
Measuring Mutuality: A Statistical Deep Dive into Social Reciprocity
Measuring tendency towards mutuality in a social network
This paper evaluates various measures for the Tendency Towards Mutuality (TTM) in social networks, comparing distance-based and model-based indices. It provides a rigorous statistical analysis showing that the distribution of mutual dyads in random graphs with fixed or bounded outdegrees converges to a Poisson distribution, validated through the Chen–Stein method and empirical data.
TL;DR
Understanding reciprocity—the "I like you, you like me" phenomenon—is central to social network analysis. This paper systematically explores how to measure the Tendency Towards Mutuality (TTM). It argues that while sophisticated exponential models ( and ) are trendy, simpler probabilistic distance indices that control for "outdegree" (how many choices an actor makes) are often more robust for comparing different social groups.
Background: The Hidden Complexity of Simple Reciprocity
When we look at a friendship graph, we count "mutual dyads" (reciprocated links). However, a raw count is meaningless without context. If everyone in a class nominates 10 friends, you expect more mutual links than if they only nominate 2, simply by chance.
The academic challenge lies in controlling the graph's structural properties to see if the observed mutuality is "real" or just a result of high activity.
The Index Landscape: From Deterministic to Parametric
The author breaks down TTM measures into three major categories:
- Deterministic Indices (): These measure where the observed count sits between the absolute minimum and maximum possible mutual dyads for a given number of links.
- Probabilistic Indices (): These treat the graph as a random realization. They ask: "How many standard deviations is our count away from the expected mean in a random graph?"
- Model-Based Indices (): These use logit models to determine the "log-odds" that a link is reciprocated, treating TTM as one parameter among many (like popularity or transitivity) defining the network's evolution.
Methodology: The Power of Poisson
A significant technical contribution of this paper is the rigorous proof of the Poisson Distribution of mutual dyads. In the "free choice" case (Case C), where actors choose a fixed number of friends, the author uses the Chen-Stein method to provide a bound on how much the real distribution deviates from a Poisson distribution.
 Table: Theoretical moments used to calculate probabilistic indices for various graph constraints.
As the graph size () increases, if the outdegree () remains small, the distribution of mutual dyads converges to , where is the expected number of mutual choices. This simplifies the calculation of P-values for mutuality significantly.
Empirical Results: The Battle of the Sexes
To test these indices, the author analyzed friendship data from a 6th-grade class (15 girls, 16 boys). The results highlight a critical warning for researchers: the choice of index matters.
- Case A (Simple): Girls appeared to have a higher tendency toward mutuality.
- Case C/D (Controlled): When controlling for the number of choices made, the boys appeared more mutual.
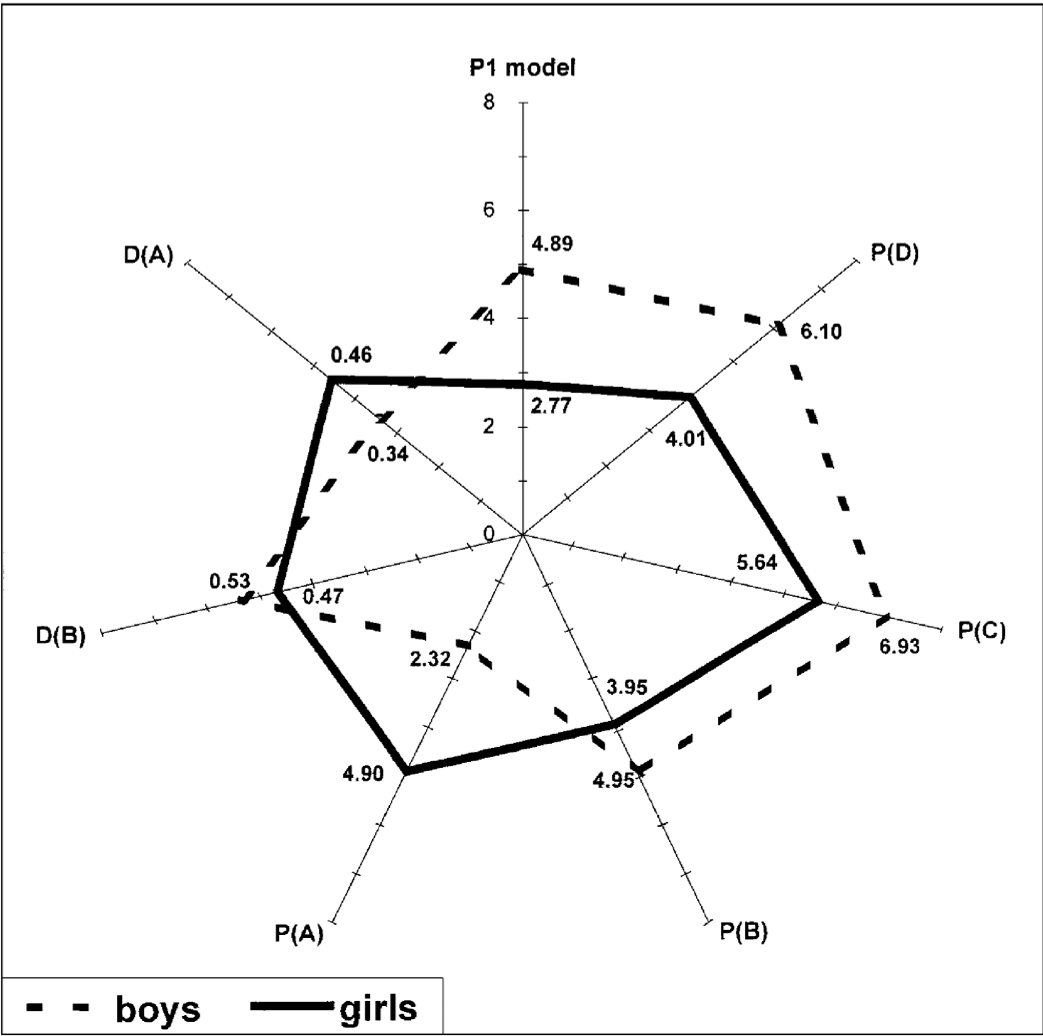 Figure: A radar chart showing how different indices ( for Deterministic, for Probabilistic) result in different magnitudes of TTM for the same dataset.
Critical Insight & Conclusion
The paper's "Why" is clear: Context is everything in social networks. If you don't control for the fact that girls might simply be more active (higher outdegree) than boys, you might misinterpret their "mutuality" as a stronger social bond when it's actually just a statistical byproduct of higher link density.
Takeaways for Researchers:
- Use Distance Indices for Comparisons: If you want to compare "Reciprocity" between School A and School B, use indices that control for outdegrees.
- Beware of P Models:* While powerful for modeling a single network's whole structure, they are too sensitive to "model selection" to be reliable for comparing across different groups.
- Poisson is your friend: For large, sparse networks, the Poisson approximation for mutual dyads is extremely accurate and mathematically convenient.
Limitations
The author notes that while Case D (controlling for both indegree and outdegree) is the most theoretically sound "pure" measure of TTM, it is computationally difficult and often requires Monte Carlo simulations because exact moments are not yet analytically solved.