
Measuring Popularity: How to Quantify User and Group Relevance in Social Networks
Measuring Popularity in Social Network Groups
This paper introduces a metric-based approach and a supporting Facebook application (GIA) to quantify the popularity and relevance of users and content within social network groups. By integrating user interactions—likes, comments, and shares—with temporal decay factors, the system evaluates the mutual value between individuals and their digital communities.
TL;DR
In an era of information overload, social network groups often become graveyard of inactive content. This paper presents a mathematical framework and a Facebook application called GIA (Group Information Aggregator) to measure exactly how "popular" a piece of content is, how much a user contributes to a group, and whether a group is still relevant to its members. By analyzing interaction data and applying temporal decay, the authors provide a way to filter the noise and manage the lifecycle of digital communities.
Background: The Problem of "Dead" Groups
Social networks naturally organize users into groups based on common interests. However, as these networks scale, we see two major issues:
- Information Overload: Constant streams of low-value content.
- Group Stagnation: Groups often lose their utility, yet members remain enrolled, leading to "ghost groups" that clutter notifications without providing value.
The authors' insight is that relevance is dynamic. A user’s value to a group depends not just on what they post, but on how the community reacts to it over time.
Methodology: The Math of Social Influence
The researchers developed three core metrics to quantify the social ecosystem.
1. Content Popularity ()
Instead of just counting "likes," the model uses a weighted formula where different actions (Comments, Shares, Likes) are balanced against the group's average activity levels. This prevents a single viral post in a huge group from skewing metrics compared to high-quality discussion in a small group.
2. User Relevance and the 60-Day Rule
To avoid rewarding "one-hit wonders," User Relevance () incorporates a temporal factor. It looks at the popularity of all contents produced by a user over the last 60 days, applying a logarithmic decay so that recent contributions carry six times more weight than old ones.
3. Group Relevance to the User
This measures if a group is actually serving the user. It considers the user's active participation (their own likes/comments) and how recently the group has seen any activity at all.
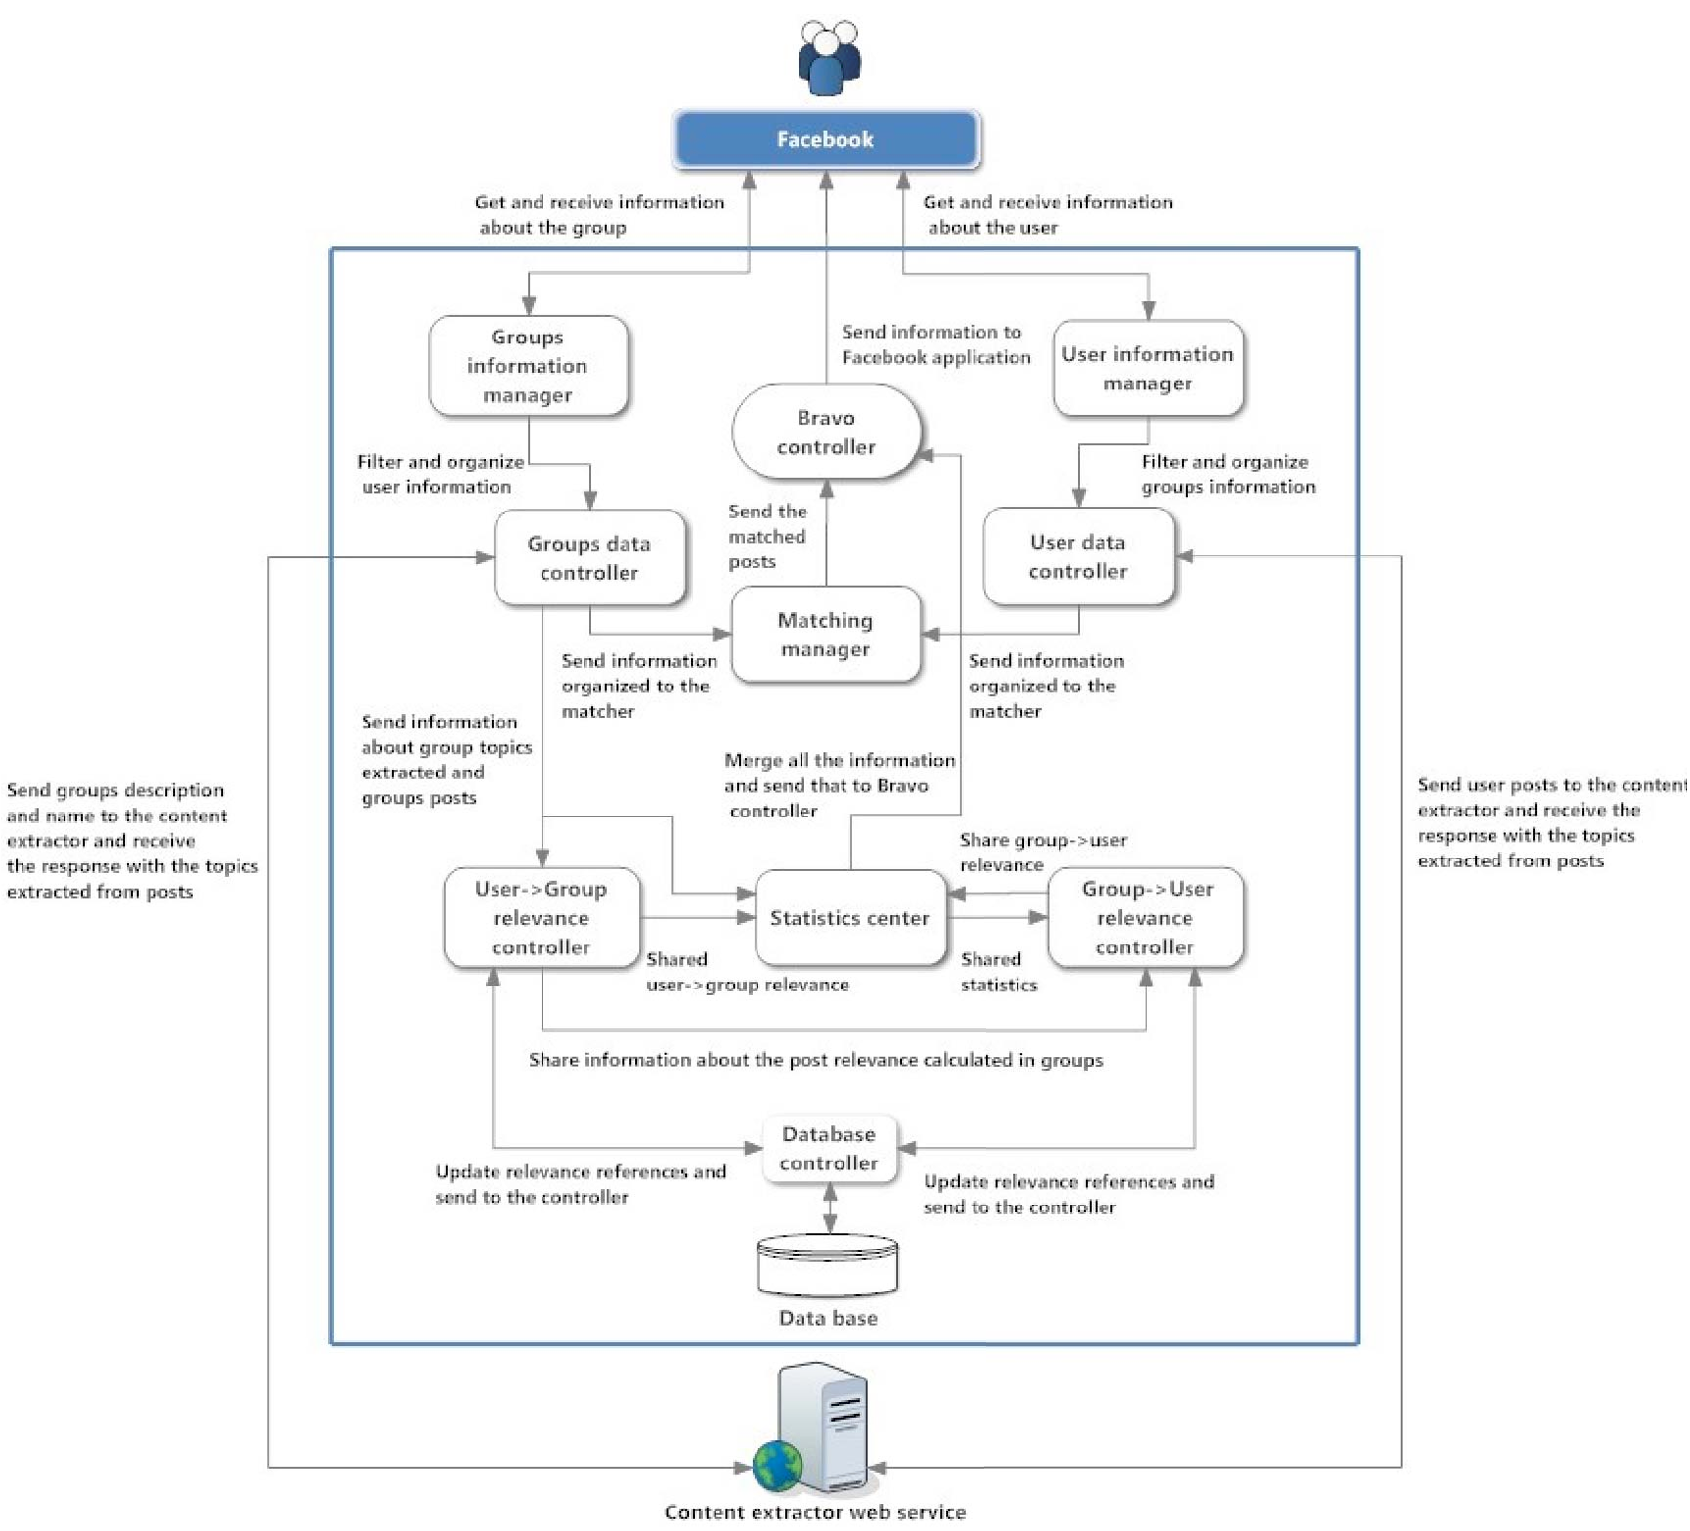 Figure 1: The GIA Application Architecture utilizing the Facebook API and Statistics Center.
Experimental Insights: Size Matters
The authors tested GIA on 47 users participating in 350 groups. The findings highlight a stark contrast in digital behavior based on group scale:
- Small Groups (2-150 members): High interaction density. Almost everyone posts and comments.
- Large Groups (>600 members): Extremely passive. In a group of 3,016 members, only 21 (0.7%) actually posted anything.
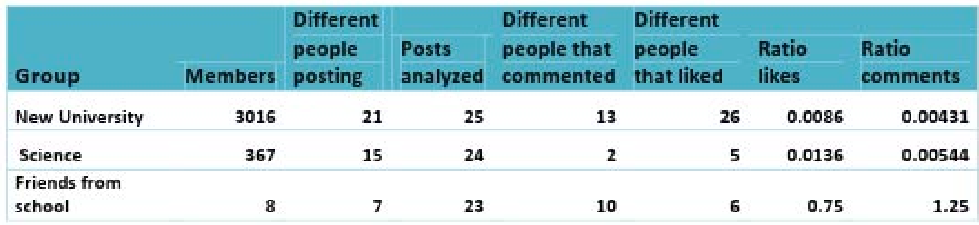 Table 1: Comparison of activity ratios across Small, Medium, and Large groups.
As seen in the data, the "Ratio of Likes" drops from 0.75 in small school friend groups to a staggering 0.0086 in large university-wide groups. This suggests that as groups grow, the sense of individual accountability and "social attractiveness" diminishes.
Critical Analysis & Conclusion
Takeaway
The paper proves that we can quantitatively distinguish between "working groups" and "inactive clusters." The introduction of the GIA tool even created a "competition effect," where users became more active once they could see their popularity scores—a precursor to modern "gamified" social metrics.
Limitations
- Subjectivity of "Like": The model treats all likes/comments as positive. It doesn't account for "hate-watching" or negative engagement.
- Privacy & Access: The study relied on a specific Facebook API era. In today’s more restrictive data environment (post-Cambridge Analytica), collecting such granular group data is significantly more difficult for third-party developers.
Future Outlook
The authors suggest that "trust" and "tie-strength" (friendship connections within a group) should be the next parameters to be integrated. Enhancing these metrics with NLP (Natural Language Processing) to analyze the sentiment of comments would likely be the next logical step for this research.