
Decoding the "Social Chameleon": A Theory-Driven Approach to Measuring Self-Monitoring via Facebook Data
Measuring Self-monitoring Using Facebook Online Data Based on Snyder’s Psychological Theories
This paper presents a novel approach to measuring the psychological trait of Self-monitoring (SM) by mining Facebook online data. Drawing on Snyder’s psychological theories, the authors integrate community-level social activity, situational factors, implicit topic modeling via LDA, and demographics to create a multi-dimensional SM classification framework that outperforms traditional single-source baselines.
TL;DR
Researchers have moved beyond simple "Likes" to measure the complex psychological trait of Self-Monitoring (SM). By mapping Facebook friendships into macro-level communities and using LDA to uncover implicit conversational topics, this study demonstrates a significant jump in classification accuracy (reaching nearly 70%) compared to traditional digital phenotyping methods.
Background Positioning
In the realm of Psychoinformatics, this work serves as a bridge between classical social psychology (Snyder’s theories) and modern data science. It shifts the focus from micro-level data (individual posts or direct friends) to macro-level structures (how a user organizes their "social worlds").
Problem & Motivation: Why Current Digital Assessments Fall Short
Self-monitoring describes how much individuals observe and control their expressive behavior in social situations. "High self-monitors" are highly sensitive to social cues—often acting as social chameleons—while "Low self-monitors" remain consistent across different groups.
Previous attempts to measure this digitally relied on:
- LIWC (Linguistic Inquiry and Word Count): Limited to pre-defined categories that might miss the implicit "vibe" of a post.
- Egocentric Networks: Focused strictly on the user’s immediate circle, ignoring the broader social environment or community organizational forms.
The authors argue that to truly "see" a social chameleon, you must see the different branches (communities) they climb on.
Methodology: The Core Architecture
The researchers built a comprehensive pipeline that transforms raw Facebook data into psychological indicators:
1. Community-Level Social Network Activity
Using the Infomap algorithm, they partitioned the Facebook graph into communities. They didn't just count friends; they calculated the Entropy of Communities ().
- Insight: If your friends are spread across many diverse, unrelated communities, it suggests you are navigating multiple social "stages," a hallmark of high self-monitoring.
2. Situational Factors
They measured the "Average Degree of First-degree connections" (ADF) and the user's "Relative Degree" (RD) within their community. This quantifies how a user stands out or blends into their specific social environment.
3. Implicit Topic Words (LDA)
Unlike LIWC, which looks for specific words, Latent Dirichlet Allocation (LDA) was used to find clusters of meaning. The study found that 50 topics extracted from 2,000 high-frequency words provided the optimal signal for SM.
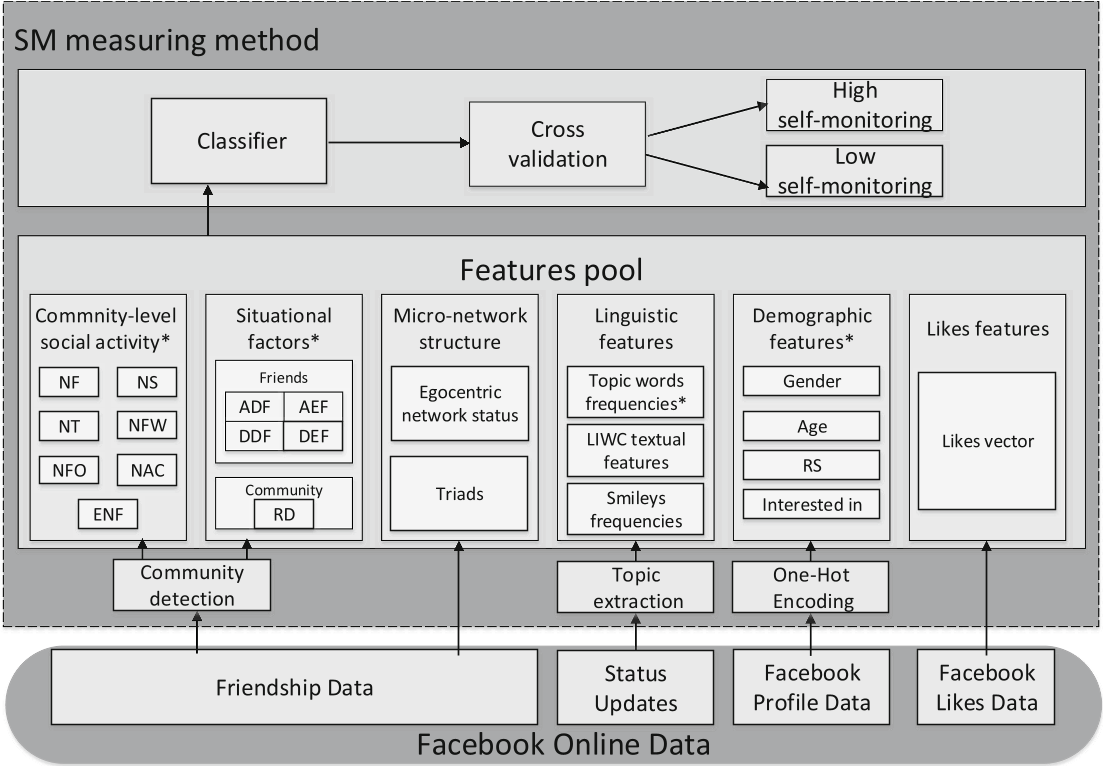 Figure 1: The proposed SM measuring framework integrating social, situational, and textual features.
Experiments & Results: Outperforming the Baselines
The study utilized the MyPersonality dataset, filtering for extreme high and low scorers (Snyder’s method). Using a Support Vector Machine (SVM) as the primary classifier, the results were definitive:
| Method | Accuracy | F1-Score |
|---|---|---|
| Facebook Likes (Baseline) | 0.6447 | 0.7125 |
| Our Multi-Feature Method | 0.6968 | 0.7468 |
| Egocentric Network status | 0.5636 | 0.6737 |
Key Insights from Results:
- Social Activity wins over Text: Community-level friendship data proved more effective than status updates alone.
- Linguistic Shifts: Topics related to family, leisure, and religion were significant differentiators. High self-monitors often use different linguistic styles to accommodate their audience.
- Ablation Study: Adding situational factors and community entropy consistently pushed accuracy higher than using simple demographic or "Like" data.
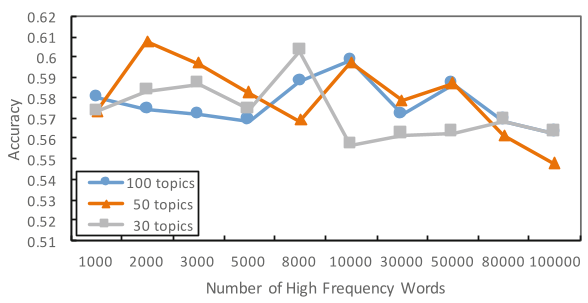 Figure 2: Performance of topic words frequency and demographics as data size increases.
Critical Analysis & Conclusion
Takeaway
The study's success lies in its Theory-to-Feature mapping. By translating Snyder's "social worlds" into "network communities," the authors provided the model with the correct Inductive Bias to understand social behavior.
Limitations
- Temporal Stability: The data is a snapshot. Personality shifts or changes in social media usage over years are not addressed.
- Algorithm Grain: The authors noted that the "grain" of community detection affects results; too fine or too coarse a partition can lose the psychological signal.
Future Prospect
This method could be extended to multi-platform analysis (e.g., comparing LinkedIn vs. Instagram behavior) to see how the "social chameleon" adapts across different digital ecosystems.