
Deciphering Digital Shadows: A Cluster Analysis of How Students Actually Watch Educational Videos
Using metrics and cluster analysis for analyzing learner video viewing behaviours in educational videos
The paper presents a comprehensive framework for capturing and analyzing learner engagement with online educational videos. By utilizing metric extraction and K-means cluster analysis, the study categorizes distinct viewing behaviors, video popularity patterns, and learner engagement profiles within Higher Education settings.
TL;DR
This research moves beyond student surveys to analyze the "digital footprints" left behind during video lectures. By extracting metrics like "percent of video watched" and "media actions per session," the authors use K-means clustering to map out the reality of student engagement—revealing that while interactive videos are pedagogically sound, most students default to linear "binge-watching" right before exams.
Context & Motivation: Beyond the Survey
In the landscape of Higher Education, video has shifted from a secondary tool to the primary medium for content delivery. However, most instructors are "flying blind," knowing only if a video was clicked, but not how it was consumed.
The authors argue that understanding learner behavior requires looking at the "micro-rhythms" of viewing:
- Linearity: Do they watch start-to-finish?
- Salvaging/Rehearsal: Do they jump back to re-watch difficult segments?
- Zapping: Do they skip through to find specific answers?
Methodology: The Tracking Framework
The researchers deployed a tracking architecture that records every pause, resume, and jump. Unlike standard analytics, this framework divides videos into "knowledge segments" rather than simple time intervals, allowing for a semantic understanding of what content is being ignored or repeated.
The core of the analysis utilizes K-Means Clustering, a centroid-based machine learning algorithm that groups observations into non-overlapping clusters based on their similarity across multi-dimensional metrics (e.g., number of days active + actions performed).
The "Reality Check" in Results
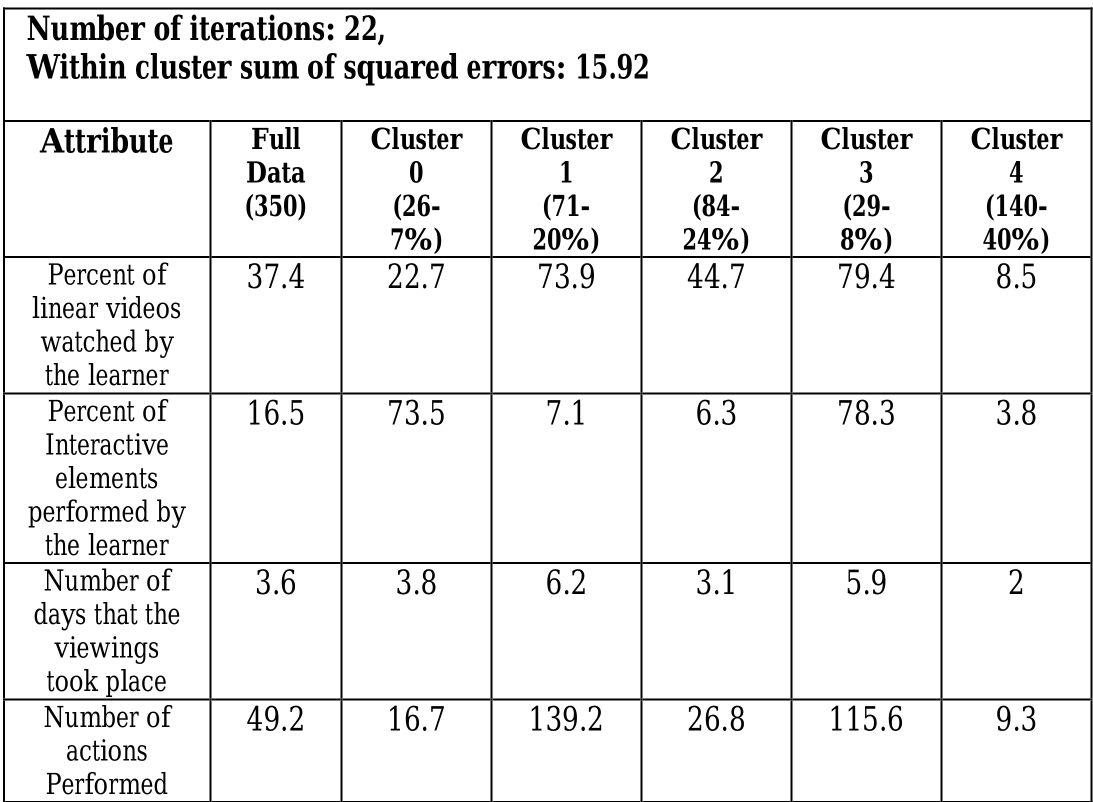
The study categorized learners into five distinct profiles. The most surprising finding? The largest group (Cluster 4, 40% of the sample) exhibited very low engagement, while only a tiny sliver (Cluster 0) truly embraced interactive learning.
Key Metrics Analyzed:
- Engagement Metrics: Number of videos started, percent distinct videos watched, and interactive elements attempted.
- Popularity Metrics: Abandonment rates (videos where <60% of sections were viewed) and total actions per video.
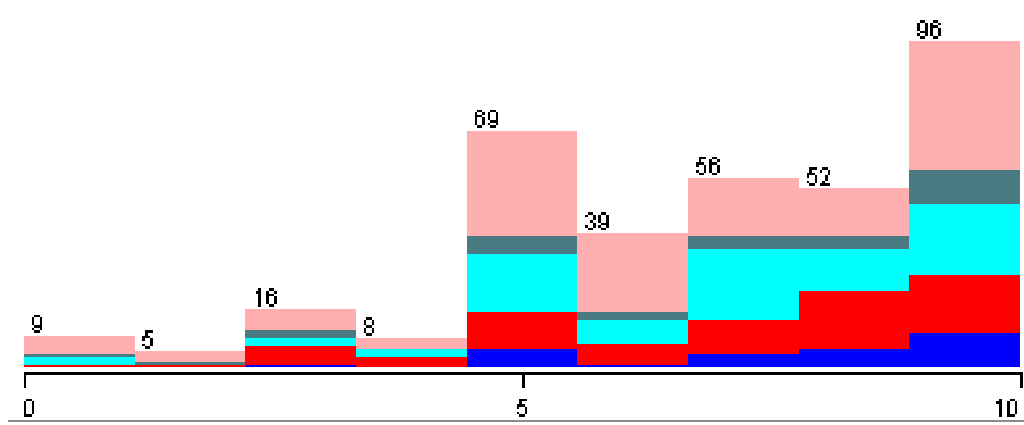
The data suggests a "just-in-time" learning culture. Almost half of the total viewings occurred in the final week before examinations. This temporal compression explains why interactive features were ignored: students prioritize speed and linear coverage when cramming, leaving no room for "trial and error" interactive simulations.
Viewing Patterns: Linear vs. Non-Sequential
The paper refines our understanding of "Viewing Sessions" by identifying eight distinct session types:
- Sequential (43%): The "Straight-Through" viewers.
- Dropout (18%): Students who start but abandon the content early.
- Non-Sequential (13%): High frequency of pause-resume and backward jumps (indicating high cognitive load or "salvaging" information).
Critical Insight & Conclusion
A striking takeaway is the lack of correlation between engagement clusters and final marks. High engagement in videos did not necessarily lead to higher grades. This suggests that videos are currently used as a "safety net" rather than the primary driver of academic excellence in blended learning environments.
Limitations: The study was conducted in a supportive setting where physical labs were also available. In a purely online MOOC (Massive Open Online Course), these behavioral clusters might shift significantly, as video becomes the only source of knowledge.
Future Outlook: For educators, the message is clear: short, high-quality linear videos remain the "gold standard" for exam revision. Interactivity is a powerful tool, but its adoption is heavily gated by student time constraints and the proximity of high-stakes testing.