
Micro-structure in Micro-neighborhoods: Why Your Distance from Neighbors Shapes Your Reality
Micro-structure in micro-neighborhoods: A new social distance measure, and its effect on individual and aggregated perceptions of crime and disorder
This study proposes a multi-dimensional social distance measure—integrating race, income, life course, and social background—to investigate its impact on perceived crime and disorder within micro-neighborhoods. Utilizing a unique longitudinal dataset from the American Housing Survey across 650+ blocks, it identifies that individual social isolation and specific block-level subgroup structures significantly predict neighborhood perceptions.
TL;DR
Is your neighborhood actually dangerous, or do you just feel that way because you're "different"? This seminal study by John R. Hipp dives into the micro-neighborhood—the immediate 10-11 houses around you—to prove that social distance (being demographically different from neighbors) is a primary driver of how we perceive crime and disorder. By moving beyond simple racial metrics, the research reveals that the structure of these differences matters: moderate diversity might actually be safer than extreme homogeneity or extreme isolation.
The "Differentness" Trap: Problem & Motivation
For decades, sociologists argued that racial "heterogeneity" led to more crime. But this view is reductive. Hipp argues that Social Distance—the gap between you and your neighbors in terms of income, education, age, and lifestyle—is the true engine of mistrust.
The problem with prior work was twofold:
- It focused almost exclusively on race.
- It assumed a linear relationship (more difference = more crime).
Hipp’s insight was to view the neighborhood as a social network matrix. If you are "socially distant," you interact less, trust less, and are more likely to interpret a group of teens on a corner as a "gang" rather than just "neighbor kids."
Methodology: Mapping the Micro-Neighborhood
The study utilized a unique subset of the American Housing Survey, interviewing "neighbor clusters" of 11 households.
The Social Distance Formula
The author didn't just look at one trait. He calculated social distance using a weighted sum of differences across:
- Economic Class: Income, home value, and home size.
- Life Course: Age, marital status, and children.
- Social Background: Education and region of upbringing.
- Race/Ethnicity.
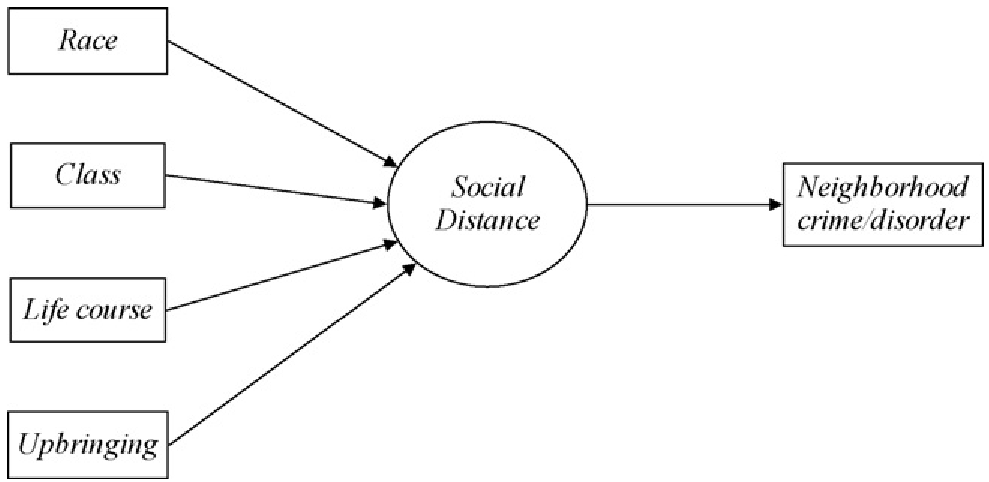 Figure 1: Conceptual model of social distance determinants.
By creating a matrix for every block, Hipp could identify subgroups. Do you have one giant group, or two tightly-knit cliques?
Key Findings: The Power of Subgroups
The results provide a fascinating look at the "physics" of social perception:
1. The Individual Isolation Effect
If you are the "odd one out" on your block, you are significantly more likely to report litter, deterioration, and bothersome people. Your lack of social ties makes you hyper-aware of—and more threatened by—disorder.
2. The Curvilinear Crime Perception
In a striking finding, blocks with moderate social distance actually perceived less crime than those with very high or very low distance.
- Low distance (Homogeneity): Leads to "Bonding Social Capital"—groups so tight they ignore the outside world.
- Moderate distance: Leads to "Bridging Social Capital"—residents have enough in common to talk, but enough differences to maintain wider networks that bring in community resources.
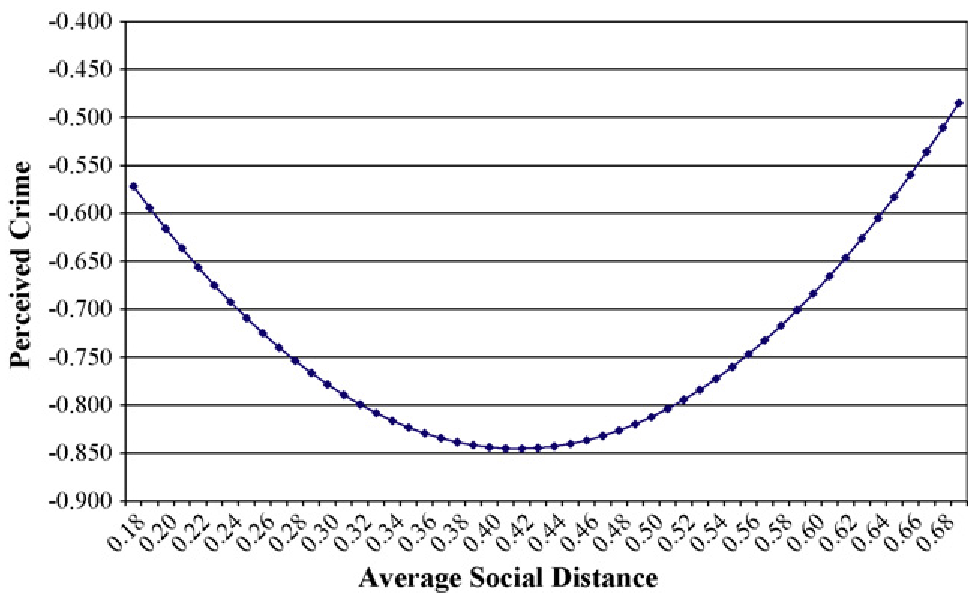 Figure 2: The non-linear relationship between block social distance and perceived crime.
3. The "Two-Clique" Buffer
Interestingly, neighborhoods split into two cohesive subgroups (Fig 2 in the paper) perceived less disorder than fragmented ones. Having some people like you, even if there's another different group nearby, provides the social support needed to feel the neighborhood is stable.
Critical Insight & Conclusion
This paper shifts the narrative from "diversity is a problem" to "isolation is the problem." It demonstrates that:
- Perception is Socially Constructed: We "see" disorder through the lens of our social network.
- Race isn't Everything: When total social distance is measured, the specific effect of racial heterogeneity often disappears, suggesting that wealth and life-stage gaps are equally potent.
Takeaway for Future Research: Urban planners and sociologists must stop treating neighborhoods as monolithic blocks. The micro-neighborhood—the few doors to your left and right—is where social control is either born or lost. To reduce fear of crime, we shouldn't just fight crime; we should fight social isolation.