
From Micro to Macro: Redefining Social Capital via Propagated Constraints
From micro to macro: Propagated constraints in social networks
The paper introduces a global node importance framework based on Ronald Burt's Structural Hole theory, proposing three novel metrics: Received Constraints (RC), Emission Constraints (EC), and the ER Ratio (ER). By implementing a constraint propagation algorithm, the authors transition from local ego-network analysis to a macro-level evaluation of a node's control and dependency within a social network, achieving high correlation with established measures like PageRank while offering deeper structural insights.
TL;DR
While most social network analysis focuses on who you know (neighbors), this paper argues that your real power comes from the "holes" you fill across the entire network. By introducing Propagated Constraints, the authors transform Ronald Burt’s local Structural Hole theory into a global metric. They propose the ER Ratio—a balance of how much you control others versus how much they control you—achieving SOTA-level accuracy in identifying key players in social structures.
Background: The Limits of Neighborhood Gossip
In sociology, Social Capital is often viewed through two lenses:
- Closure: Deep trust within a tight-knit group.
- Structural Holes: The competitive advantage gained by connecting two groups that are otherwise disconnected.
For decades, Ronald Burt’s "Constraint" metric has been the gold standard for measuring these holes. However, it had a fatal flaw: it only looked at the Ego Network (immediate neighbors). In a globalized digital world, influence isn't just local; it propagates. If you are a bridge between two bridges, your importance is macro, not just micro.
Methodology: The Mechanics of Propagation
The authors break down node importance into two reciprocal forces:
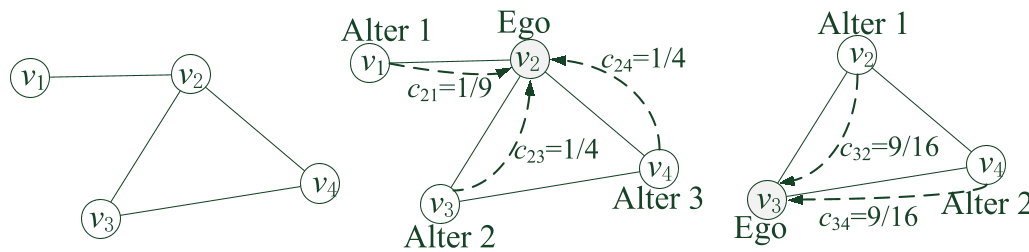
- Received Constraints (RC): How much your neighbors (and their neighbors) limit your options. High RC means you are "trapped" in a dense cluster.
- Emission Constraints (EC): How much you limit the options of others. High EC means you are a vital gatekeeper.
The Propagation Algorithm
To move from local to global, the authors developed an iterative algorithm that mimics how constraints flow through the shortest paths of a network.
The core logic follows an iterative matrix multiplication: By extending this across -distances, the model captures the ER Ratio ( ):
Experiments: The Karate Club Fission
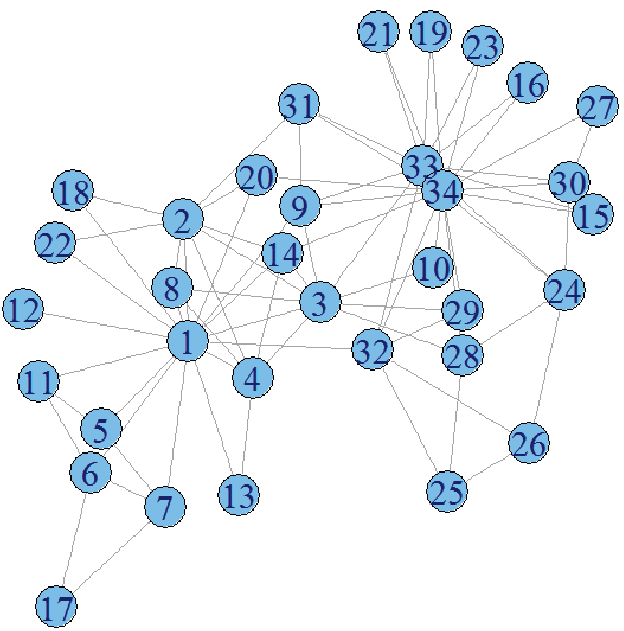
The authors validated their model using the famous Zachary’s Karate Club dataset—a social network that famously split into two factions.
Insights from the EC-RC Plot
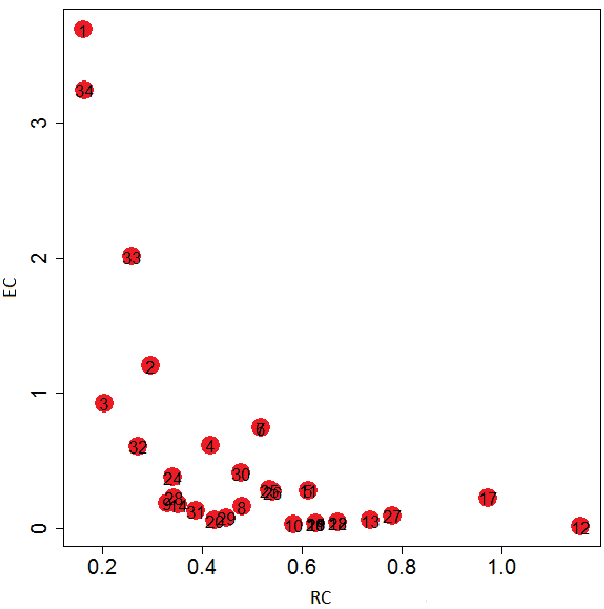
By plotting nodes on an EC-RC scatter plot, the authors could distinguish between "Hubs" and "Brokers."
- Nodes #1 and #34: High Emission, Low Reception. These are the undisputed leaders.
- Node #9: An anomaly. Standard metrics struggle with it, but the Propagated Constraint model correctly identifies its unique position—it received fewer constraints than expected because it was strategically "neutral" during the club's split.
Deep Insight: Beyond PageRank
While the ER Ratio correlates highly with PageRank (0.97), its motivation is fundamentally different. PageRank views links as "votes" of importance. Propagated Constraints view links as "cages" or "bridges" of control. This makes the ER Ratio particularly powerful for:
- Rumor Prevention: Identifying who can stop a flow, not just who starts it.
- Organizational Health: Finding employees who span departments but lack formal "Degree" centrality.
Conclusion & Future Outlook
The shift from "Micro" ego-networks to "Macro" global constraints is a significant leap for structural hole theory. While the current algorithm focuses on undirected, unweighted graphs, the logic is ripe for application in Supply Chain Resilience (identifying bottleneck suppliers) and Infrastructure Security.
The main limitation remains the potential complexity in very dense, large-scale networks, suggesting that future work will need to explore sparse matrix approximations or heuristic propagation to scale to Facebook-level graphs.