
Decoding the Genome: Enhancing Microarray Clustering with GO Ontology
Finding microarray genes using GO ontology
The paper presents a methodology for analyzing gene expression patterns by integrating DNA microarray data with Gene Ontology (GO) annotations. It utilizes the K-means clustering algorithm to group genes based on their participation in specific Biological Processes, Cellular Components, and Molecular Functions, achieving a more biologically meaningful classification compared to traditional expression-only clustering.
TL;DR
In the world of bioinformatics, clustering is a standard tool, but the results are only as good as the context provided. This paper proposes a method to move beyond raw data by using the Gene Ontology (GO) to guide K-means clustering. By mapping expression data to biological functions, the researchers discovered genetic associations that standard statistical clustering simply couldn't see.
The "Blind Spot" in Genomic Clustering
For years, researchers have used DNA microarrays—often called "gene chips"—to monitor thousands of genes at once. However, clustering these genes based purely on expression similarity is like grouping books in a library by the color of their covers rather than their subject matter.
The authors identify two critical pain points:
- Noise: Raw microarray data is notoriously messy, filled with empty spots and null values.
- Lack of Meaning: Two genes might exhibit similar expression levels by chance without sharing any physiological relationship. This makes it difficult to discover the actual genetic mechanisms underlying diseases.
Methodology: Bridging the Gap between Data and Biology
The proposed framework shifts the focus toward functional profiles. Instead of treating every gene as an anonymous data point, the authors integrate the Gene Ontology (GO)—a structured, directed acyclic graph (DAG) that categorizes gene products into:
- Biological Processes (What are they doing?)
- Cellular Components (Where are they located?)
- Molecular Functions (How do they interact?)
The Framework Highlights:
- Preprocessing: Noisy data is cleaned using the
knnimputemethod, reducing 6,400 genes to 6,314 high-quality candidates. - Mapping: Microarray genes are mapped to the Saccharomyces Genome Database (SGD) structure to extract specific GO terms.
- K-means Clustering: The core algorithm uses Euclidean distance within a Vector Space Model (VSM) to group genes by their specific functional taxonomies.
 Figure 1: The three-phase framework: Preprocessing, Mapping, and Association Analysis via Clustering.
Discovery via "Landmark Genes"
One of the paper’s unique insights is the use of Landmark Genes. By selecting specifically annotated genes as anchors for their clusters, the authors could perform what they call "External Validation."
A key example provided in the study concerns Putative proteins of unknown function. In the raw data, these genes often appeared isolated. However, once clustered by GOid (e.g., GOid 8150 for Biological Process), these unknown genes grouped consistently with known genes, offering a strong hint about their actual role in cellular tissues.
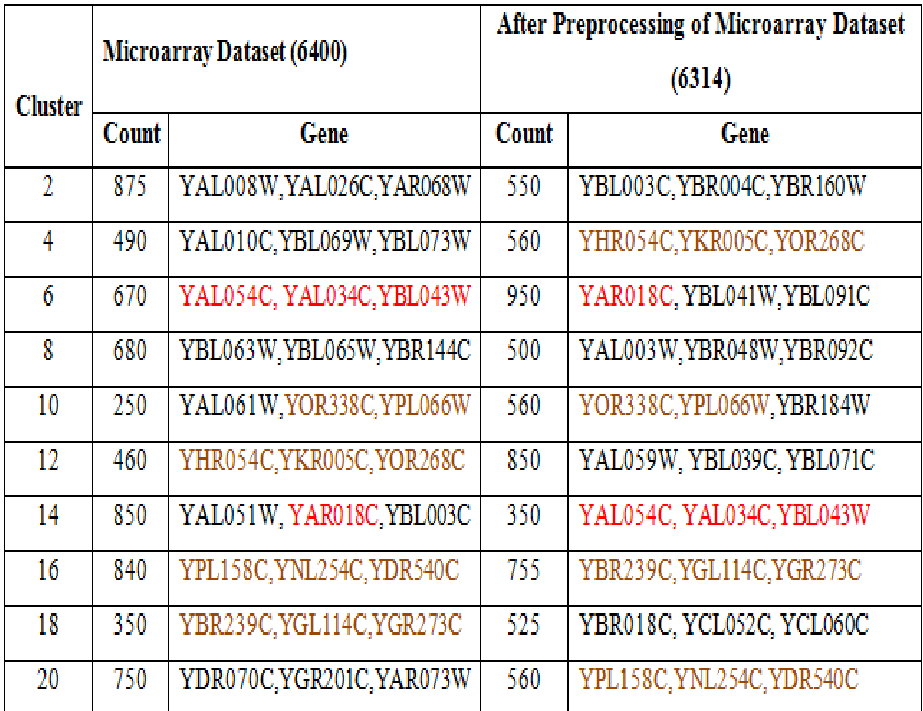 Table 1: Comparison of K-means clusters before and after preprocessing, showing how data refinement changes gene distribution.
Key Results & Discussion
The study proved that:
- Context Matters: The same gene (e.g.,
YAR068W) might be assigned to different clusters depending on whether you are looking at it through the lens of its molecular function or its cellular component. - SOTA Refinement: Using threshold-based landmark gene selection (threshold >= 10), the authors identified 272 significant terms that act as definitive biological signatures.
- Discovery of the Unknown: The clustering approach successfully grouped biologically meaningful but previously "unknown" functions based on their persistent association with known GO IDs like 3674 and 5737.
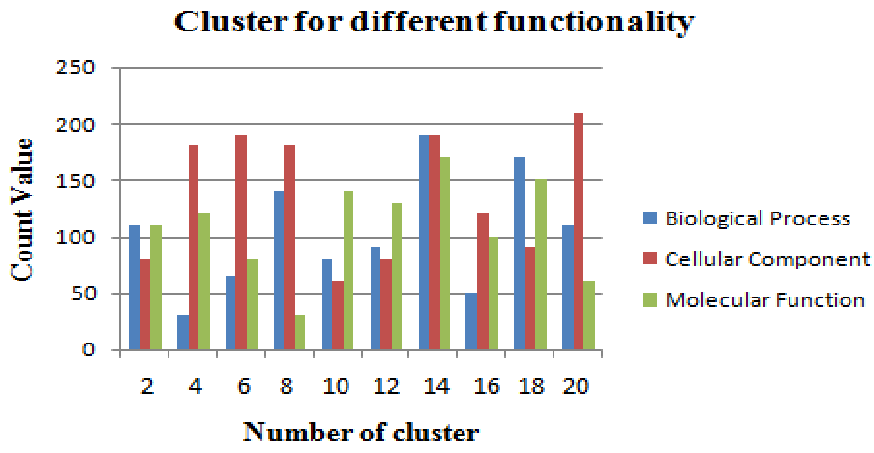 Figure 2: Distribution of genes across the three orthogonal taxonomies of the Gene Ontology.
Critical Insight: Why This Works
The brilliance of this approach isn't in a new clustering algorithm—K-means is a decades-old staple. Instead, it lies in the incorporation of an Inductive Bias. By forcing the clustering to respect GO Ontology boundaries, the authors ensure that the resulting patterns are biologically grounded. It prevents "spurious correlations" where two genes seem related in a single experiment but have no real interaction in a living organism.
Future Outlook
While this 2010 study laid critical groundwork, the authors acknowledge the dynamic nature of these ontologies. As new GO terms are added (now exceeding 20,000), the potential for even more granular discovery increases. The next step for this line of research is moving from static yeast datasets to complex, multi-species disease models where functional mapping is even more vital.