
Mining the Invisible: How IoT Unmasks the Energy Inefficiency of Schools
On Mining IoT Data for Evaluating the Operation of Public Educational Buildings
This paper presents a data mining framework utilizing the GAIA IoT platform to evaluate the operational performance of 18 public educational buildings across Greece, Italy, and Sweden. By analyzing two years of longitudinal sensor data, the study establishes a quantitative methodology for assessing thermal comfort and identifying building energy inefficiencies.
TL;DR
Researchers from Sapienza University of Rome have leveraged a three-country IoT infrastructure (GAIA) to turn raw sensor data from 18 schools into a diagnostic tool for building health. By filtering out the "noise" of daily student life, they have developed a method to pinpoint structural flaws—like poor insulation and missing window blinds—using nothing but temperature and humidity time-series data.
Positioning: This work moves beyond academic simulations into the realm of Applied Data Jurisprudence for public infrastructure, providing a scalable blueprint for "Smart City" educational management.
The "Data Gap" in Public Education
Public schools are notorious for being energy sinks. Historically, heating and cooling costs were viewed as "inevitable." The challenge isn't just the age of the buildings (ranging from 1950s to 2000s); it's the lack of Quantitative Evidence. Without knowing how a classroom interacts with the sun or its own HVAC system, building managers are essentially flying blind.
The GAIA project aims to solve this by deploying over 725 sensing points, but as the authors highlight, real-world data is "dirty"—riddled with outages (network failures) and outliers (sensor glitches).
Methodology: From Raw Bits to Building Insights
The paper's core contribution lies in its robust data cleaning and comparative evaluation framework.
1. Handling the "Lossy" Reality
Using low-cost IoT devices in stone or concrete school buildings leads to significant packet loss. The authors utilized:
- IQR Filtering: Using the interquartile range to flag and replace spikes (e.g., humidity dropping to 0% due to sensor error).
- Moving Window Averages: To smooth short-term fluctuations and fill "holes" in the data streams.
2. The Weekend Strategy
To understand if a room is "thermally lazy" (poorly insulated), you have to remove the humans. By analyzing temperature trends during weekends, the study isolated the Building Envelope performance from Occupant Behavior.
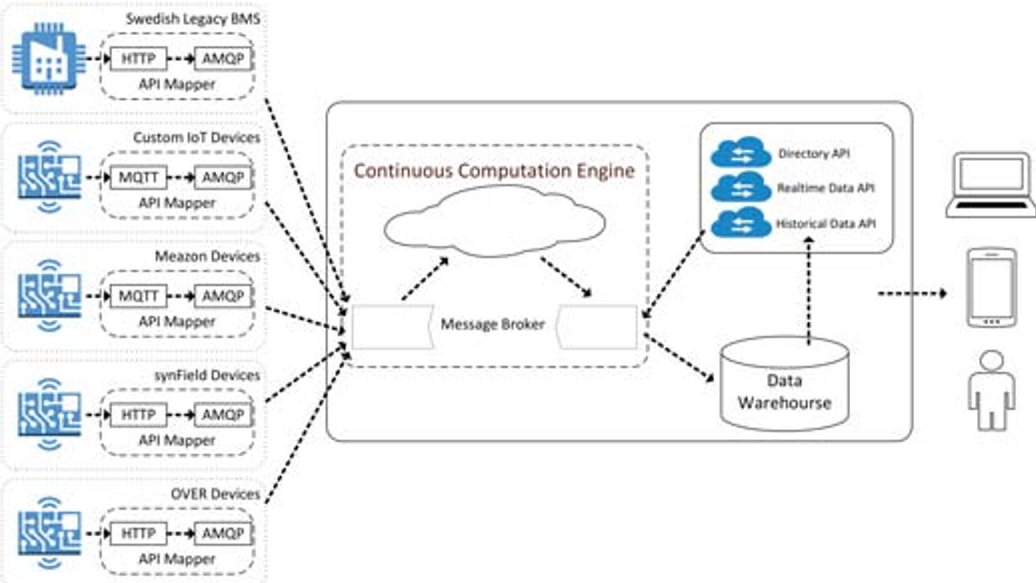 Figure 1: The GAIA IoT deployment architecture, spanning across classrooms, weather stations, and power meters.
Comparative Comfort Analysis
The authors didn't just look at temperature; they calculated Thermal Comfort using the ASHRAE-55 standard, which considers outdoor conditions and wind speed.
Interestingly, the study found that orientation (South-East vs. South-West) significantly impacts productivity. Classrooms facing South-West were exposed to longer periods of sun, maintaining higher temperatures that could lead to reduced student attention spans.
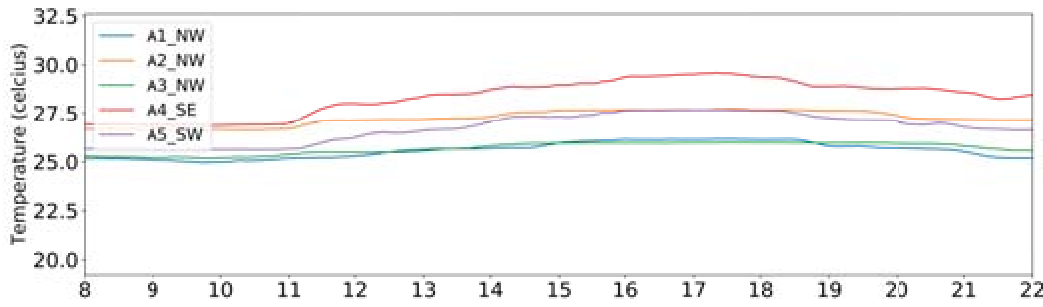 Figure 2: Comparative Thermal Comfort levels across various school sites. Site C (Southern) demonstrates higher comfort than Site I (Northern).
Identifying the "Prefab" Problem
The most striking result came from comparing two schools in the same city. The data mining approach flagged one room (R1) that was heating up from 20°C to 32°C in a single day—a massive swing. Upon manual inspection triggered by this data, it was confirmed that the room was a "prefabricated iso box" with virtually no insulation. Similarly, the sensors detected a 2-degree heat gain in rooms without window blinds compared to those with them.
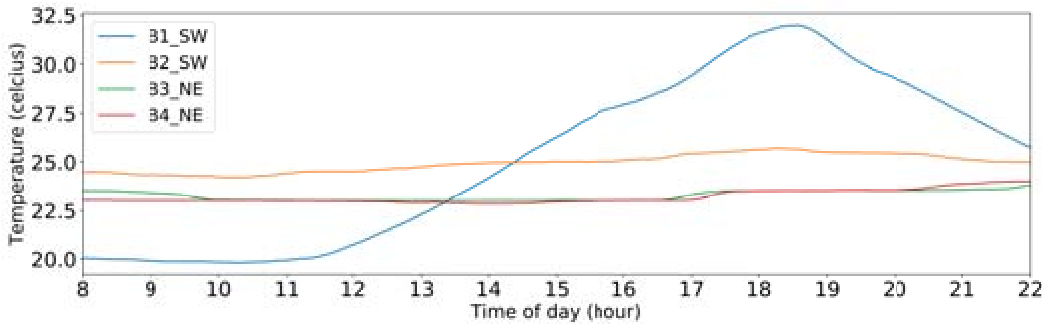 Figure 3: Thermal signatures during a Saturday (no occupants) identifying the rapid overheating of poorly insulated classrooms.
Critical Insight & Future Outlook
This paper proves that we don't need million-dollar sensors to fix our schools; we need better Data Mining on the sensors we already have.
Takeaways for the Industry:
- Scalability: The "moving window" and "weekend analysis" techniques are low-cost and can be applied to any IoT-enabled building.
- Actionable Data: Instead of generic energy-saving tips, managers get "Targeted Interventions"—e.g., "Install blinds in Room 4 specifically."
Limitations: The study currently lacks integration of air quality (CO2) and noise data, which are critical for a holistic Internal Environment Quality (IEQ) assessment. Future versions of this framework should incorporate these variables to correlate thermal comfort with actual student performance metrics.