
Mining the Scientific Web: Using MST to Decode Collaborative Design
Mining and analyzing organizational social networks for collaborative design
This paper presents a data mining framework using Minimum Spanning Trees (MST) to detect and analyze collaboration patterns within organizational social networks. Focusing on the Brazilian Computing Science academic landscape, it identifies inter-institutional and intra-institutional research clusters to improve multidisciplinary team formation in collaborative design.
TL;DR
In the complex world of collaborative design, finding the right partners is often a game of chance. This paper introduces a systematic way to map Organizational Social Networks using data mining and Minimum Spanning Trees (MST). By analyzing the Brazilian Computing Science ecosystem, the authors demonstrate how to identify "knowledge centralizers" and optimize multidisciplinary team formation.
Problem & Motivation: The "Silo" Effect in Innovation
Why is it so hard to form a perfect multidisciplinary team? Most organizations rely on formal hierarchies, but real innovation happens in the informal social network. The authors argue that current methods for analyzing these networks are insufficient for Collaborative Design—a philosophy that requires integrating dispersed designers and resources.
The pain point is clear: Without a quantitative way to measure the "strength" of relationships and profile similarity, we can't identify why certain groups succeed while others fail to communicate.
Methodology: Pruning the Social Graph
The core of this work lies in treating a social network like a geographical map.
1. The Social Graph Construction
The researchers mapped 190 professors based on:
- Nodes: Profiles including academic training, publication counts, and research areas.
- Edges: Relationships defined primarily by co-authorship, project participation, and examination boards.
2. MST and Group Detection
Instead of just looking at raw connection counts, the authors used the PRIM algorithm to build a Minimum Spanning Tree. To find distinct "communities," they employed a pruning strategy based on a dissimilarity measure. If an edge's weight (representing the gap in profile/collaboration) exceeded a certain threshold, it was cut, leaving behind natural clusters of high-intensity collaboration.
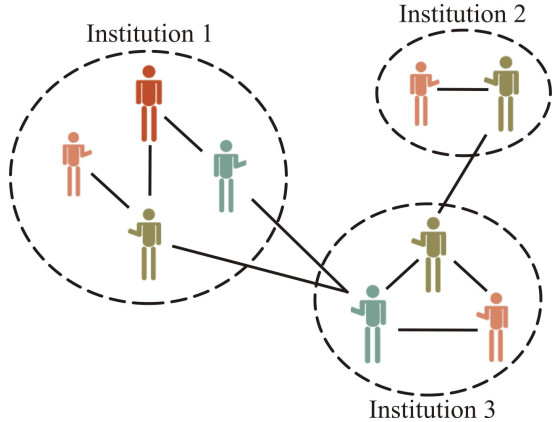 Figure 1: A conceptual example of a Scientific Social Network where nodes represent researchers and edges represent collaborative ties.
Experiments: Analyzing the Brazilian CS Landscape
The authors applied this to the top-tier "Level 6 and 7" Computing Science programs in Brazil.
Key Findings:
- Internal vs. External Profiles: They identified "Internal Centralizers" (professors who anchor their own university) vs. "External Collaborators" (those who act as bridges to other institutions).
- The UFRGS Paradox: UFRGS had the highest number of total external relationships (780), but a lower density of strong ties compared to UFMG. This suggests that UFRGS acts as a wide-reaching networker, while UFMG focuses on deep, high-output partnerships.
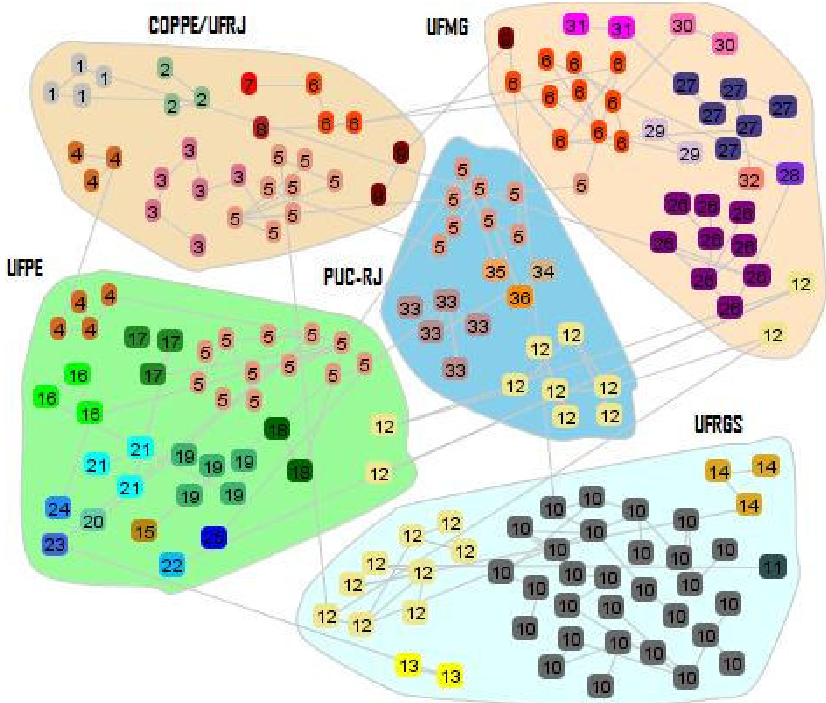 Figure 2: The generated MST showing how different Brazilian universities (large regions) cluster together through specific "bridge" researchers.
Validation
To ensure the algorithm wasn't just hallucinating clusters, the authors conducted qualitative interviews at COPPE/UFRJ. The results matched: areas like Databases, Software Engineering, and Information Systems showed high algorithmic clustering, which professors confirmed were their primary interdisciplinary hubs.
Critical Analysis & Conclusion
Deep Insight
The real value of this paper isn't just in the clustering—it's in the differentiation of relationship types. By distinguishing between a "Unit Group" (a researcher working in isolation or only with students) and a "Knowledge Centralizer," organizations can strategically "seed" innovation by connecting a centralizer from one field (e.g., AI) to an external collaborator in another (e.g., HCI).
Limitations
- Temporal Dynamics: The data is static (1947-2007). Social networks are fluid; a "centralizer" today might retire tomorrow.
- Weight Sensitivity: The results are highly dependent on the chosen threshold for "strong" vs. "weak" ties.
Future Outlook
The authors plan to move toward a recommendation system for researchers. Imagine an "Amazon for Collaboration" where the system suggests: "Users who collaborated with Professor X also found success in working with the Digital Manufacturing Lab at University Y." This represents the future of AI-assisted R&D management.
Takeaway: To optimize collaborative design, don't just look at who knows whom—look at the topology of the network to find the bridges that haven't been built yet.