
Mining the Social Learning Graph: Can Network Position Predict Academic Success?
Mining relationships in learning‐oriented social networks
This paper presents "SocialWire," a custom-built Social Learning Environment (SLE) designed to bridge the gap between formal LMS functions and informal social interactions. Using Social Network Analysis (SNA) on datasets from two course iterations, the authors investigate how student participation patterns in peer-to-peer Q&A sessions correlate with academic success and network topology.
Executive Summary
TL;DR: This study explores "SocialWire," a social learning platform that integrates informal Q&A games into formal university courses. By applying Social Network Analysis (SNA) to two years of student data, the researchers discovered that while how much you interact (your centrality) strongly predicts your grade, who you interact with (your neighbors' grades) has almost no impact on your performance.
Background: Positioned at the intersection of Computer-Supported Collaborative Learning (CSCL) and Data Mining, this work validates social participation as a proxy for learning engagement, moving beyond simple click-stream data to structural relationship analysis.
The "Web 1.0" Problem in Education
Most modern universities still use Learning Management Systems (LMS) like Moodle or Blackboard. While functional, these platforms are essentially digital filing cabinets. They lack the social "meritocracy" and informal knowledge exchange—the know-who and know-how—found in real-world professional networks. The authors argue that informal learning is vital for capturing tacit knowledge, yet it remains largely unmeasured and unsupported in traditional digital classrooms.
Methodology: Gaming the Classroom
The researchers developed SocialWire, based on the Elgg engine. The core engine is built on four pillars:
- Online Social Network: A public wall for communication.
- Formal Processes: Quizzes and task submissions.
- Informal Processes: The "Q&A Game" where students earn reputation points.
- Collaborative Work: Subgroup workspaces for team projects.
The critical data comes from the Q&A Game, where directed edges in a social graph are formed when one student answers another's question.
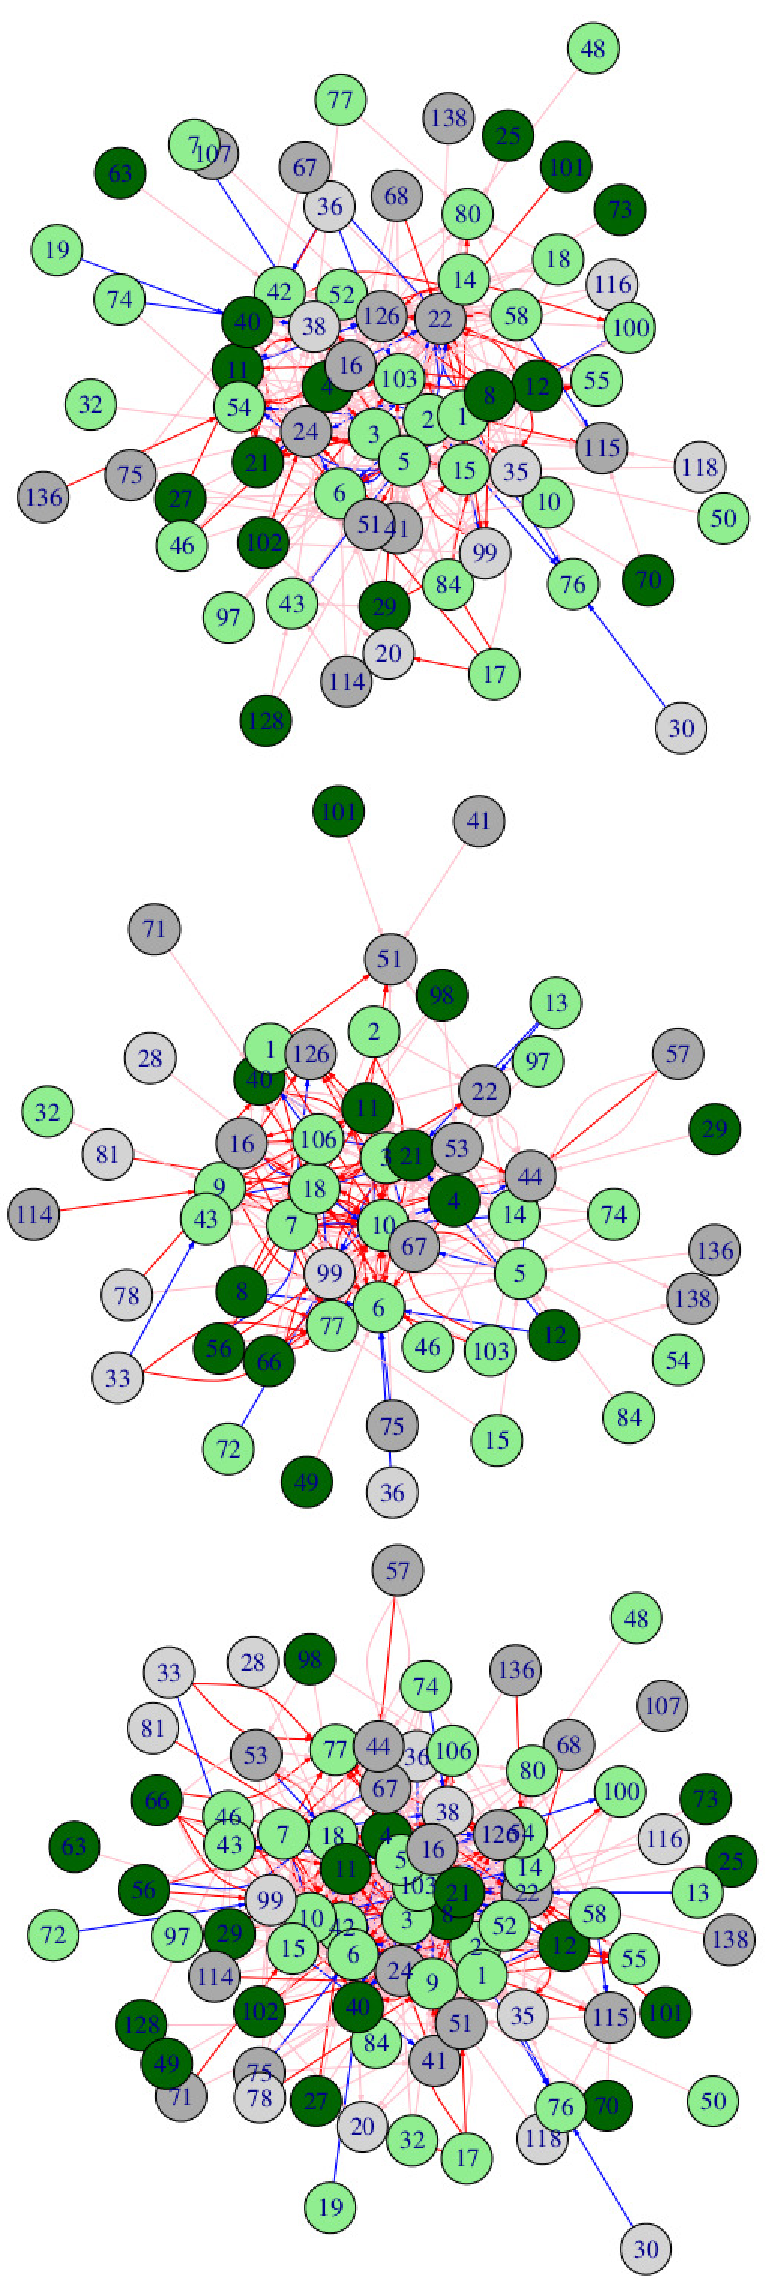 Figure: The evolution of student interactions before and after midterms. Node colors represent academic outcome (Pass/Fail).
Deep Insight: Centrality vs. Neighborhood
The study utilized several SNA metrics to deconstruct the student experience:
1. Centrality as a Predictor
The authors found a statistically significant positive dependence between Out-degree centrality (the number of answers a student provides) and their final performance.
- Insight: Students who answer questions are not just being helpful; they are reinforcing their own knowledge. Being a "hub" of information is a leading indicator of a 5.0 grade.
2. The Lack of Homophyly (Assortativity)
Surprisingly, the study found low assortativity. In social media, we usually see "birds of a feather flock together." In SocialWire, high-performing students did not specifically cluster with other high-performers.
- Insight: The social flow of information is democratic and somewhat random. An "A" student's performance is not hindered by interacting with a "C" student, nor is it automatically boosted by having "A" student neighbors.
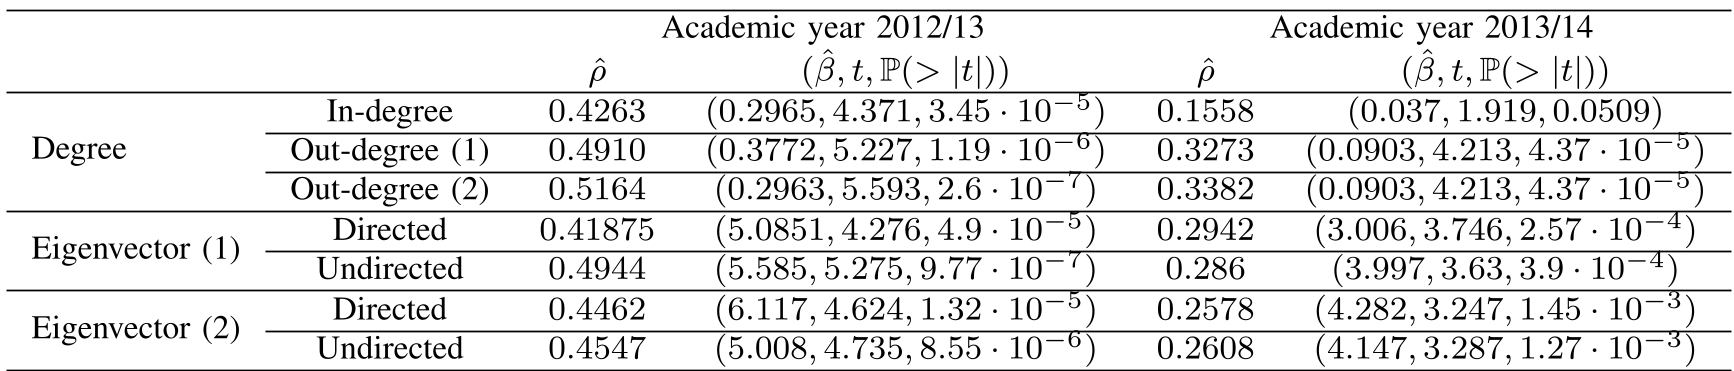 Table: Statistical correlation showing high t-values for centrality measures relative to final grades.
Experiments & Results
The comparison between two academic years (2012/13 and 2013/14) revealed:
- Midterm Stimulus: Interaction density and reciprocity significantly increased after the midterm exam. Students used the social network as a survival mechanism once they realized the difficulty of the course.
- Transitivity: The clustering coefficient was notable, suggesting that while strong mutual reciprocity was rare, small communities of 3 or more students frequently formed to solve problems.
- Prediction Potential: The correlation between Eigenvector Centrality (being connected to other active users) and grades was consistently high across both years.
Critical Analysis & Conclusion
Takeaway
The research proves that social participation is a high-fidelity signal for academic success. Educators can use centrality metrics to identify "at-risk" students (those with zero or low centrality) weeks before a final exam even occurs.
Limitations
- Incentive Bias: Because points contributed 10% to the final grade, the "social" behavior might be partially extrinsic. It remains unclear if these patterns hold in zero-reward environments.
- Sparse Density: The graphs remained relatively sparse, meaning only a fraction of students drove the majority of the knowledge exchange.
Future Work
The authors suggest building accurate prediction models that trigger automated interventions when a student's social graph position suggests they are disengaging from the collective learning process.