
The Power of the Taste Graph: Scaling Music Discovery at Social Network Scale
Mining Users Playbacks History for Music Recommendations
This paper introduces a robust framework for music recommendations within the "Odnoklassniki" social network, utilizing a multi-dimensional "Taste Graph" processed via Random Walks with Restarts. The system integrates user playbacks, demographic profiles, and track/artist similarities into a unified stochastic graph structure to deliver real-time personalized content.
Executive Summary
TL;DR: Researchers from "Odnoklassniki" (OK.ru) have developed a sophisticated recommendation engine that models the complex relationship between users, artists, and tracks as a dynamic Taste Graph. By applying Random Walks with Restarts and clever data-cleaning heuristics, they achieved a system capable of daily updates for over 40 million users, significantly outperforming traditional collaborative filtering baselines.
Background: This work resides at the intersection of graph theory and industrial recommender systems. It isn't just a theoretical model; it's a battle-tested architecture designed to handle the noise and scale of one of Eastern Europe's largest social networks.
Problem & Motivation: The Sparsity and Aging Trap
In large-scale music services, two demons plague developers:
- Metric Sparsity: Calculating similarity between millions of tracks using standard Pearson Correlation requires massive compute power and often yields poor results because most tracks share very few common listeners.
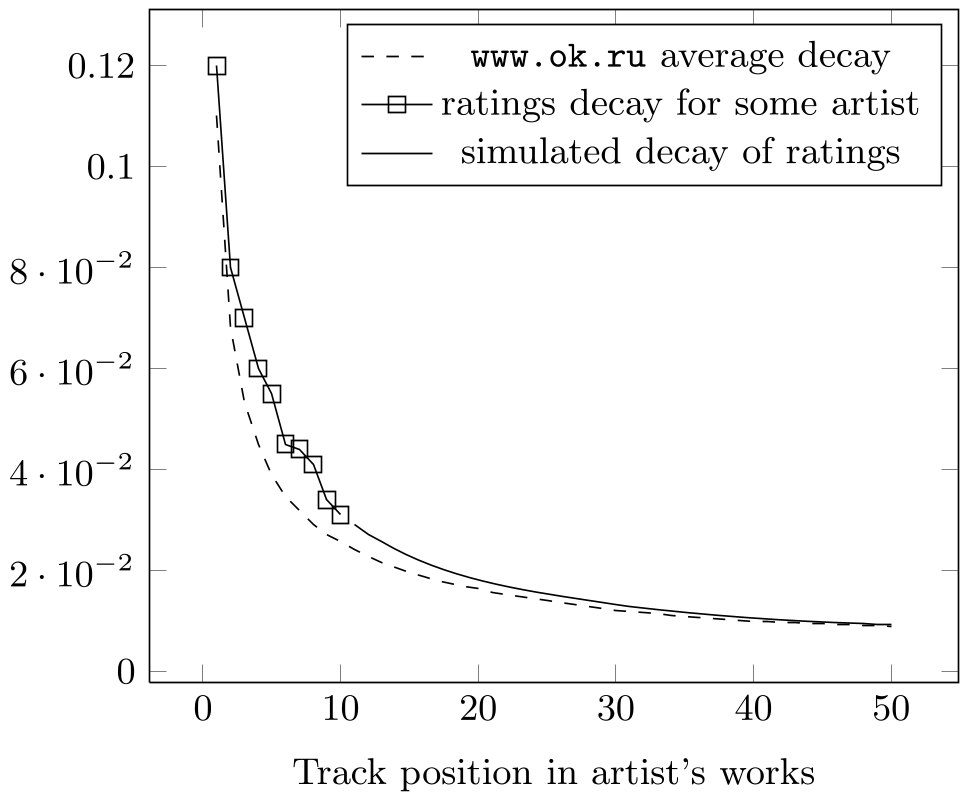
- Preference Stagnation: User tastes change. A track you loved five years ago shouldn't necessarily define your recommendations today, yet cumulative playback counts often "trap" users in their old habits.
The authors' intuition was to move away from static "rating" vectors and toward a dynamic graph that values the recency of actions and the topological structure of music discovery.
Methodology: Engineering the Taste Graph
The core of the system is a stochastic graph where edges are meticulously weighted through several distinct sub-algorithms.
1. Temporal Track Similarities
Instead of complex vector math, the authors use Temporal Correlations. They measure how often tracks and are listened to within a limited time window by the same user, then subtract a "popularity baseline" to ensure that hits don't just link to other hits by accident.
2. Handling the Cold Start with "Demography Profiles"
For new users with no history, the graph connects them to a "Demographic Group" vertex. This vertex aggregates the preferences of users with similar age, gender, and region, allowing the Random Walk to find relevant "entry-level" music until the user builds their own playback history.
3. The Balancing Vertex ()
One of the most elegant mathematical "hacks" in the paper is the inclusion of the balancing vertex . If a node (like a niche artist) has too few outgoing edges, it can create "sinkholes" in the graph that bias the Random Walk. The vertex absorbs excess probability, ensuring the graph remains stable and stochastic without over-recommending obscure items.
 The graph structure enables diverse paths like User → Artist → Similar Artist → Track, increasing recommendation novelty.
Experiments & Results: Real-World Impact
The researchers didn't just test this in a lab; they deployed it to OK.ru's massive audience.
- Recall-Precision Curves (RPC): The "Temporal Correlation" method for tracks (Section 2.3) showed a marked improvement over the baseline (Koren & Bell style shrinkage).
- Online Activity: When the proposed Taste Graph was replaced by a more traditional similarity baseline in a live environment, user activity dropped by 10%. In the world of social media, a 10% swing in engagement is massive.
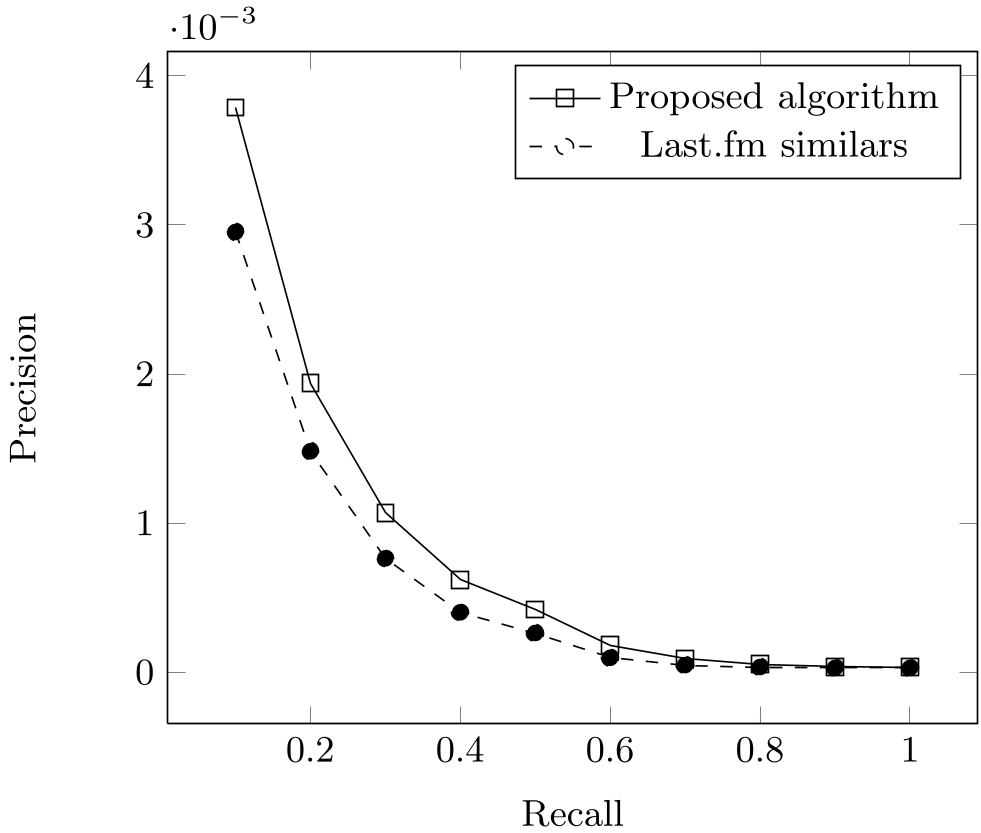 Fig 3. Performance comparison on artist similarity using Last.fm API as a benchmark.
Critical Analysis & Conclusion
Takeaway
The success of the Taste Graph lies in its modular construction. By calculating user preferences, artist similarities, and demographic profiles independently and then "stitching" them into a graph, the authors created a system that is both flexible and highly performant on Hadoop/Mahout clusters.
Limitations
- Demographic Leakage: The authors admit that large demographic groups can sometimes "dilute" niche collaborative correlations, potentially leading to generic recommendations for certain segments.
- Hyper-parameters: The balancing function and the smoothing factor require careful tuning, which may change as the social network's user base evolves.
Future Outlook
The next step for this lineage of research is the integration of Latent Factors (SVD) directly into the graph edges. This would allow the system to capture abstract "vibe" or "genre" similarities that raw playback history might miss, further bridging the gap between collaborative filtering and content-based recommendation.