
Beyond Static Links: Tracking the Pulse and Evolution of Online Subgroups
Mining and Visualizing the Evolution of Subgroups in Social Networks
This paper introduces a framework for mining and visualizing the temporal evolution of subgroups in social networks, specifically targeting online communities. It proposes a hierarchical edge betweenness clustering approach and a novel "Community History" visualization to track structural changes even in environments with high membership fluctuation.
TL;DR
In the digital age, communities are living organisms—they grow, shrink, split, and merge. Most tools look at individuals, but this paper zooms out to the subgroup level. By treating community instances as nodes in a higher-order graph, the researchers from the University of Magdeburg demonstrate how to track persistent social structures even when the members themselves are in constant flux.
Background: The Fluidity Problem
Traditional Social Network Analysis (SNA) is excellent at telling you who is influential or how a specific friendship changes. However, it often misses the "forest for the trees." In dynamic environments—like a university forum where students graduate every year—the community remains even if the people change entirely. Prior work lacked the tools to visualize this Metabolic Evolution of groups.
Methodology: Two Lenses of Analysis
1. The Statistical Lens (Stable Groups)
For communities with a solid core, the authors use a Sliding Window approach. They slice time into 14-day segments and apply a hierarchical divisive clustering algorithm based on Edge Betweenness. This identifies dense clusters where "everyone knows everyone." They track these via:
- Cohesion & Density: Measuring if the group is becoming a "clique" or leaking out to the rest of the network.
- Structural Equivalence: Using Euclidean distance to see if the group's "shape" today matches its shape yesterday.
2. The Persistence Lens (Fluctuating Members)
To solve the problem of high turnover, they introduce a brilliant abstraction: The Graph of Similar Community Instances.
- Similarity defined by Overlap: If group A at time and group B at time share a threshold of members (), they are linked.
- Clustering the Meta-Graph: By clustering these instances, they discover a "Community Lineage" that spans months, regardless of individual member churn.
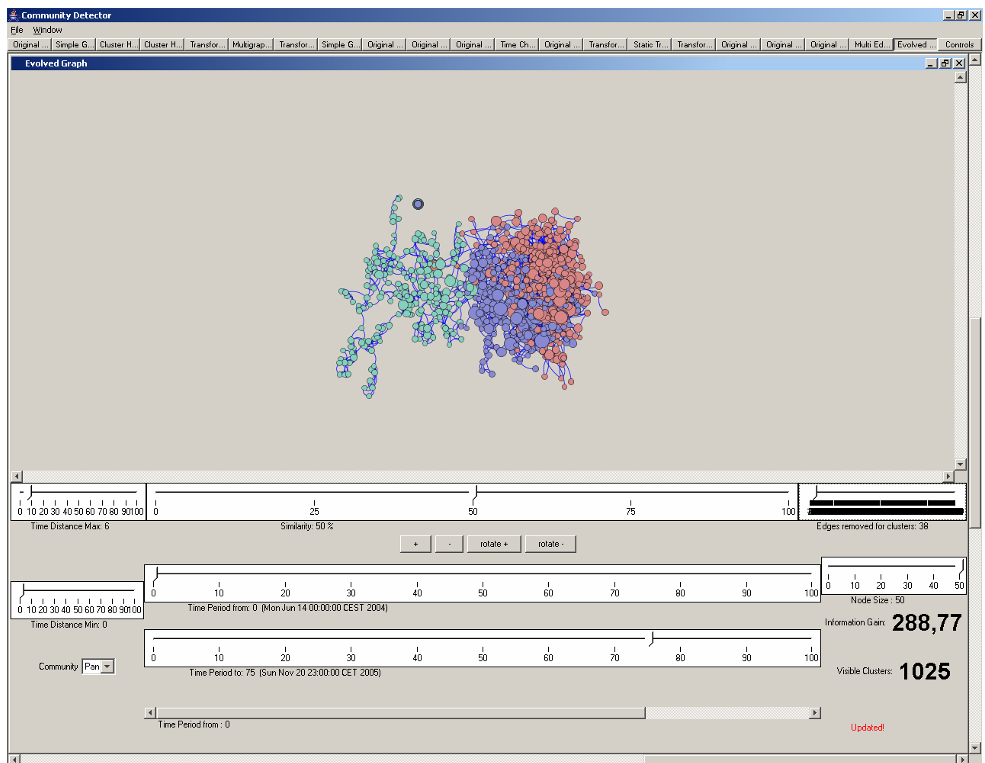 Figure 1: The Control Panel and Meta-Graph layout where nodes represent community instances.
Real-World Evidence: The Student Community
The authors tested this on an international student platform (75 weeks of data). The results weren't just mathematical—they were sociological.
Detecting "Structural Breaks"
The system detected clear "breaks" (color changes in the visualization) that mapped perfectly to:
- Summer Breaks: A mass exodus of international students.
- Winter Term Starts: An explosion of new, small, fragile subgroups.
- Christmas Holidays: A fascinating shift where people who stayed online reached out to strangers, creating a temporary but radical change in the network's topology.
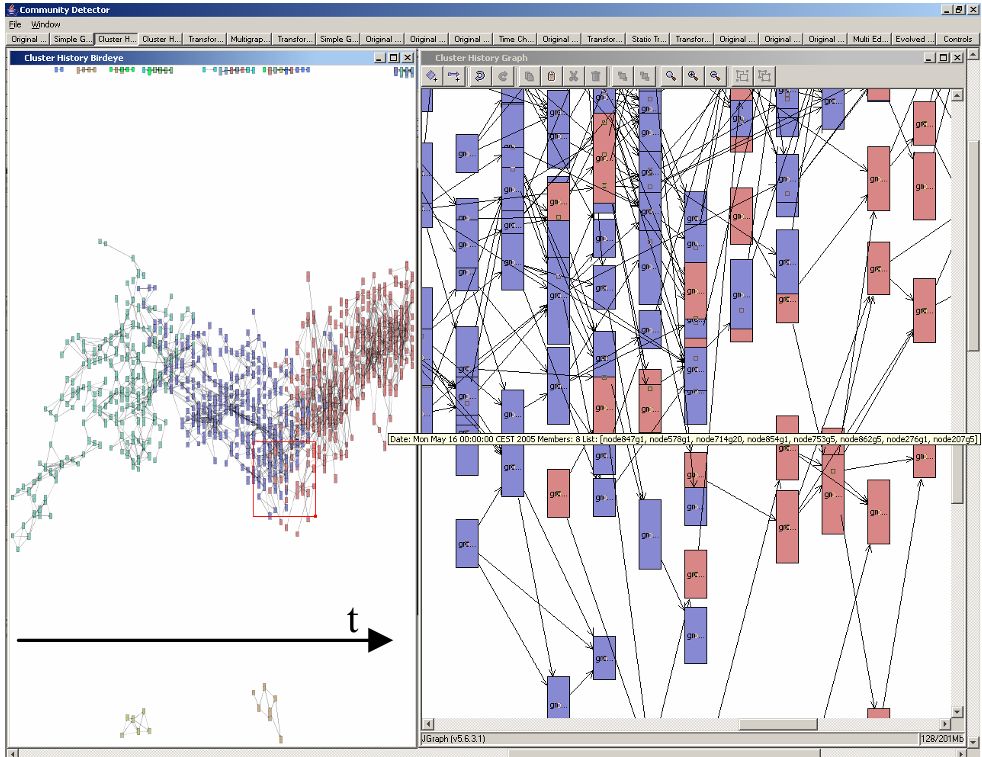 Figure 2: The Community History View. The x-axis represents time, showing how groups (rectangles) evolve, merge, or dissolve.
Critical Insight & Conclusion
The true value of this work lies in the Transition Logic. By moving from a vertex-level view to an instance-level view, the authors provide a way to monitor the "health" of organizations and online platforms.
Limitations: The reliance on hierarchical edge betweenness is computationally expensive for massive-scale networks (like modern-day X or Reddit). However, the logic of Temporal Overlap remains a gold standard for understanding how collective identities survive individual departures.
Future Outlook: Integrating these visualization techniques with modern Graph Neural Networks (GNNs) could allow us to predict when a community is about to fracture before it actually happens.