
Beyond the Dashboard: The Power of Mixed Methods in Enterprise Social Network Analysis
Mixed methods analysis of enterprise social networks
2014-12-24
Summary
Problem
Method
Results
Takeaways
Abstract
This paper presents a conceptual framework and a mixed methods research approach for analyzing Enterprise Social Networks (ESN). By integrating four key data dimensions—Activities, Content, Relations, and Experiences—the researchers provide a holistic methodology to evaluate employee interaction, knowledge transfer, and organizational structures.
## TL;DR
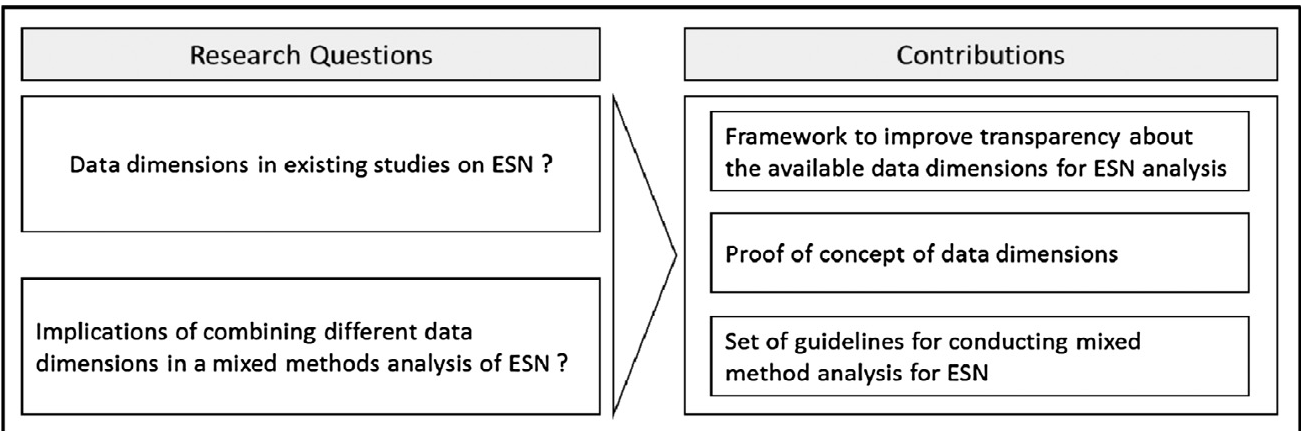
Enterprise Social Networks (ESNs) like Yammer, Slack, or Microsoft Teams generate a goldmine of data, yet most organizations fail to look beyond surface-level activity. This paper introduces a robust framework that combines **Activities, Content, Relations, and Experiences** to provide a 360-degree view of corporate social health. Through a case study of a hierarchical military organization, the researchers demonstrate why "what people say" and "what people do" in a network are often two very different things.
## The Illusion of Connectivity: Why Single-Source Data Fails
Most ESN analyses suffer from a "partial view" problem. If you only look at **Log Files**, you see *how much* people are typing but not *why*. If you only use **Surveys**, you get "socially desirable" answers—people telling you what they think they *should* be doing.
The authors argue that ESN data is uniquely volatile. Digital traces of human behavior (likes, posts, tags) are different from traditional social ties. To truly understand if a platform is fostering innovation or just hosting "non-work chatter," we need a methodology that bridges the qualitative-quantitative divide.
## The 4D Framework of ESN Data
The researchers categorized ESN data into four essential dimensions:
1. **Activities (Usage Data)**: The "Digital Footprint." Collected via log files and web analytics (e.g., page views, visit peaks).
2. **Content (User-Generated Data)**: The "Message." Analyzed through **Genre Analysis** or Sentiment Analysis to understand the purpose of communication (e.g., is this a task coordination or a book sale?).
3. **Relations (Structural Data)**: The "Map." Using Social Network Analysis (SNA) to visualize hierarchies, clusters, and "superspreaders."
4. **Experiences (Reported Data)**: The "Context." Gathered through interviews to understand user motivations and feelings toward the platform.
## Case Study: Hierarchy vs. Reality in "Med-Net"
The framework was tested on "Med-Net," an ESN for the German Armed Forces' medical unit. In a high-rank, high-discipline environment, the results were eye-opening.
### Key Insight 1: Conflicting Results
In interviews, soldiers claimed that **military rank played no role** in their online interactions—they felt the platform was a "flat" space. However, the **Relational Analysis (SNA)** told a different story. The data showed that networking was heavily stratified; users primarily interacted with peers of their own rank. This "Conflict" highlighted a gap between the organizational ideal and actual behavior.
### Key Insight 2: Clarification of Peaks
The **Activity Data** showed massive spikes in visits on certain days. Without qualitative data, a manager might assume a successful marketing campaign. However, **Interviews** revealed the truth: superior officers were "strongly encouraging" (essentially commanding) subordinates to log in during training events.
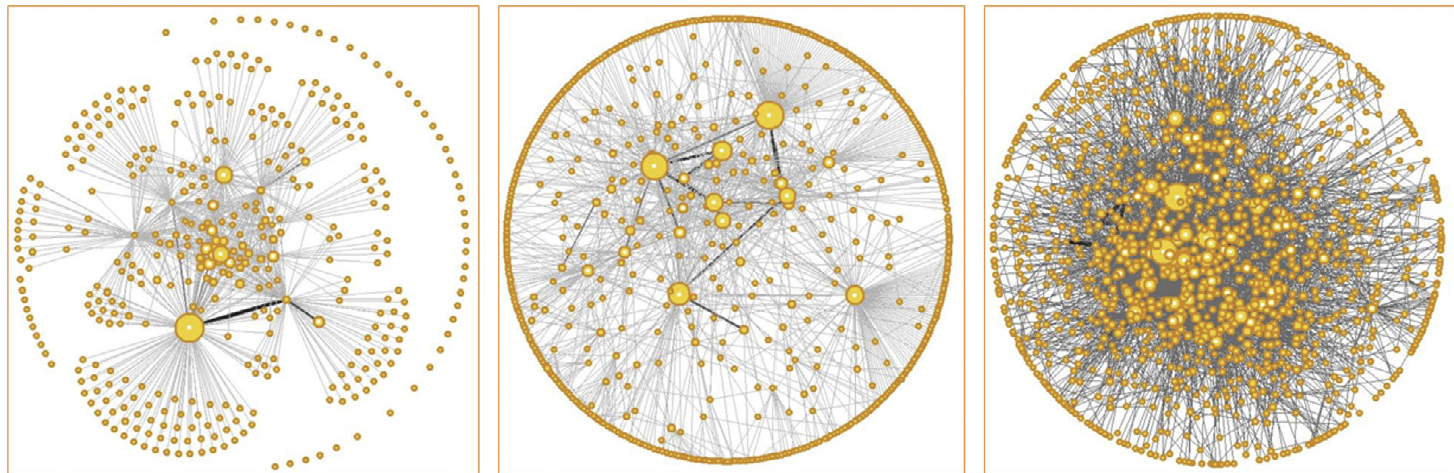
*Fig: Visualization of different network layers—Content (1), Direct Messages (2), and Contact Requests (3).*
## Strategic Guidelines for Decision Makers
The paper concludes with a "Toolbox" for researchers and managers. A few standout directives:
* **Triangulate for Validity**: Use Content analysis to confirm if "visit peaks" actually resulted in meaningful knowledge exchange.
* **Watch for "Hidden" Clusters**: Use SNA to see if your remote offices are becoming isolated digital silos.
* **Address Usability through Experience**: If log data shows low feature usage, don't assume the feature is useless—interviews might reveal it simply has a poor UI/UX.
## Conclusion: The Holistic View
The true value of an Enterprise Social Network isn't in its user count, but in the **alignment** between user intentions and structural reality. By treating ESN analysis as a "Mixed Methods" endeavor, organizations can stop chasing vanity metrics and start building genuine, cross-functional communities.
**Takeaway for the Future**: As AI-driven sentiment analysis and automated SNA become more prevalent, this framework provides the logical grounding needed to ensure we don't lose the "human context" in a sea of big data.