
Decoding the Silent Pulse: Modeling Anonymous Human Behavior on YouTube
Modeling anonymous human behavior using social media
The paper investigates anonymous human psychology through a quantitative analysis of YouTube metadata using a dataset of Hindi language songs. Utilizing the WEKA machine learning tool and regression analysis, the authors model the relationships between views, likes, and dislikes to uncover patterns in social media participation.
TL;DR
Is social media a true mirror of society? This study analyzes YouTube metadata from Hindi music videos to explore the psychological underpinnings of anonymous interactions. By applying regression analysis, the researchers discover that digital "leadership" is rare—only 1% of users express opinions—and that every popular movement carries a built-in 5-10% resistance factor.
Context & Positioning
In the landscape of social media research, most studies rely on self-reported surveys or active participant tracking. This paper, however, takes a quantitative data-mining approach to "User Generated Content" (UGC). It positions YouTube not just as a video repository, but as a "Content Community" where anonymous actions reveal the unexploited nature of human psychology.
Motivation: The Mystery of the Anonymous Click
The authors argue that the transition from Web 1.0 to Web 2.0 shifted the power of content modification from administrators to the masses. However, this freedom brings complexity. The paper seeks to answer:
- Is there a predictable relationship between how much a video is watched and how much it is liked?
- Does "anonymity" change how we express resistance toward popular topics?
Methodology: From Raw Clicks to Psychological Insights
The researchers tasked 30 students with collecting real-time data on 200 Hindi songs. After a rigorous data cleaning process (removing outliers and duplicates), 130 songs remained.
The Analytical Framework
The experiment utilized a dual-module approach:
- Regression Analysis (WEKA): To find mathematical correlations between attributes like
VIEWS,LIKES, andDISLIKES. - Statistical Profiling (Excel): To categorize the distribution of "dislike percentages" and "opinion-to-view ratios."
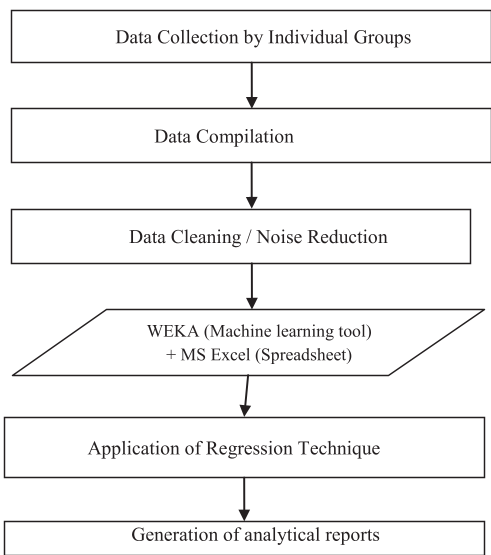 Figure 1: The experimental workflow from data collection to inference.
Key Findings & Intuitions
1. The "Leadership" Deficit (The 1% Rule)
A striking finding was that in 119 out of 130 songs, the "Total Opinion" (Likes + Dislikes) accounted for less than 1% of the total views.
- The Intuition: In any large population, very few individuals possess "leadership qualities" or the drive to express their stance publicly, even when protected by anonymity. Most humans remain "passive observers."
2. The Baseline of Resistance
The study observed that approximately 5-10% of the population will stand against a largely popular idea, regardless of its quality. This suggests a psychological "resistance constant" in social communities.
3. The Popularity Paradox
Using WEKA for regression, the authors found a near-perfect correlation (0.9998) between Likes and Total Opinion. However, the correlation between Views and Opinions was remarkably low (~0.36).
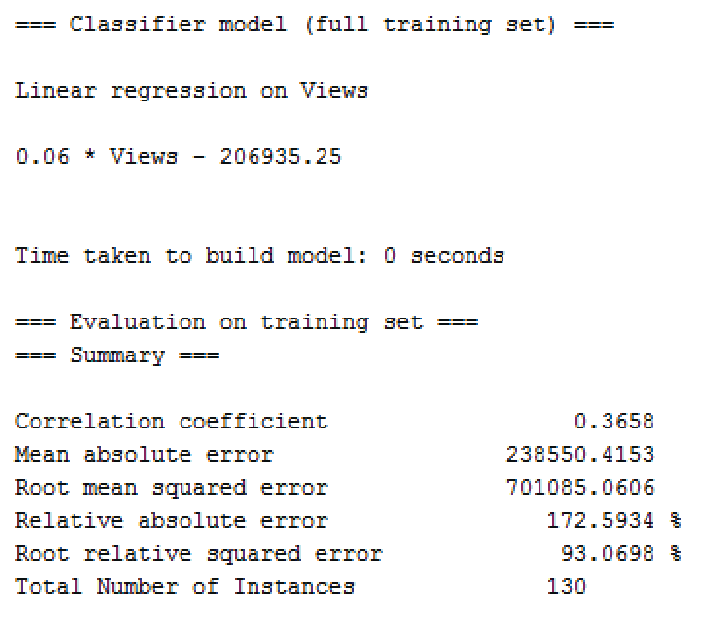 Figure 2: The scatter plot reveals that more views do not linearly lead to more expressed opinions, showcasing the erratic nature of web data.
Critical Analysis & Conclusion
The Value
This research provides a sobering look at digital engagement. It validates the theory of media richness, suggesting that the most valuable psychological data is "hidden" and requires transformation into a knowledge base rather than simple surface-level counting.
Limitations
The study is constrained by its niche dataset (Hindi language songs) and specific age group (17-21). Furthermore, simpler regression models may fail to capture the multi-modal reasons for video "virality," which often involves external social factors not present in YouTube metadata alone.
Final Takeaway
For developers and marketers, the message is clear: Engagement is not a function of reach. Predicting human behavior on social media requires understanding that the "vocal" 1% dominates the sentiment, while the "silent" 99% remains a psychological black box.