
Modeling Malware Propagation: Leveraging the Social DNA of Smartphone Networks
Modeling Malware Propagation in Smartphone Social Networks
The paper proposes a novel analytical model for SMS/MMS-based malware propagation by integrating mathematical epidemic theory with a social relationship graph. By analyzing real-world messaging records from a logic of social trust, the authors develop a strategy to simulate infection dynamics with specific attention to node-level heterogeneity.
TL;DR
This research shifts the perspective of malware modeling from static differential equations to dynamic social relationship graphs. By analyzing 20 million SMS/MMS records, the authors demonstrate that malware doesn't just spread through connections—it spreads through trust. They introduce a refined SIR-based model that accounts for individual "Infected Factors" and "Resistance Factors," providing a more granular look at how mobile viruses like Commwarrior exploit our digital social circles.
Problem & Motivation: The Failure of Blind Epidemics
Early models treated smartphones like biological entities in a well-mixed room—assuming every "interaction" had an equal chance of infection. However, smartphone malware, particularly those using SMS/MMS vectors, relies on the Social Relationship Graph.
A user is far more likely to click a malicious link or download an infected MMS if it arrives from a frequent contact. Prior work often missed this "Individual Difference." The researchers identified that to truly model a smartphone outbreak, we must account for the intensity and reciprocity of communication between specific pairs of nodes.
Methodology: Mapping Trust into Math
The core of this paper lies in the construction of a Social Relationship Graph , where weights are determined by Weekly Averaged Traffic (WAT).
1. The Social Graph
The authors used a massive dataset from a major Chinese cellular carrier (0.4 million users) to build a graph where the weight of an edge represents the total volume of messages exchanged. High-degree nodes (social butterflies) act as super-spreaders, while isolated nodes act as firewalls.
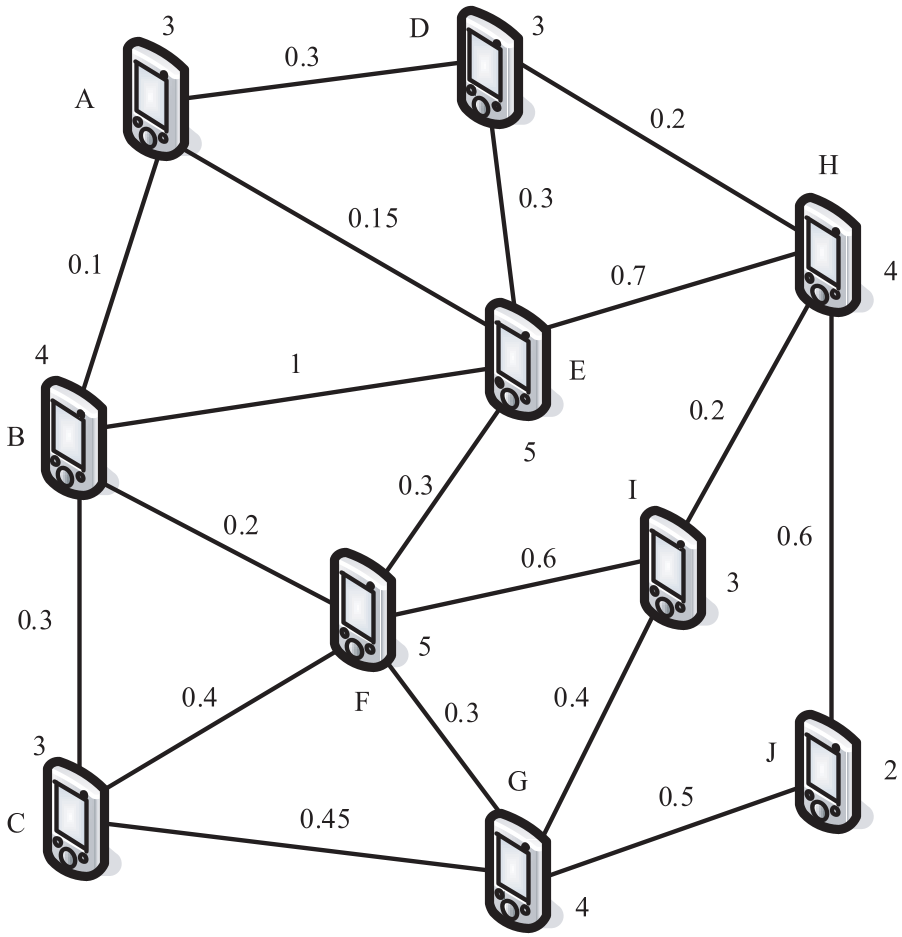 Fig 1: A visualization of social connections where edge thickness represents communication frequency.
2. Infection and Resistance Factors
Unlike standard models, this paper introduces two dynamic factors:
- Infected Factor (): The "viral load" node exerts on node .
- Resisted Factor (): The internal resistance of node .
The state transition from Susceptible () to Infected () is no longer a coin flip; it is a calculated Infection Degree () based on the ratio of to .
Experiments & Results: The Lifecycle of an Outbreak
The researchers implemented a C++ simulator using 5,114 nodes from the real-world dataset. The simulations reveal a classic bell-shaped curve for infected nodes but with specific social nuances.
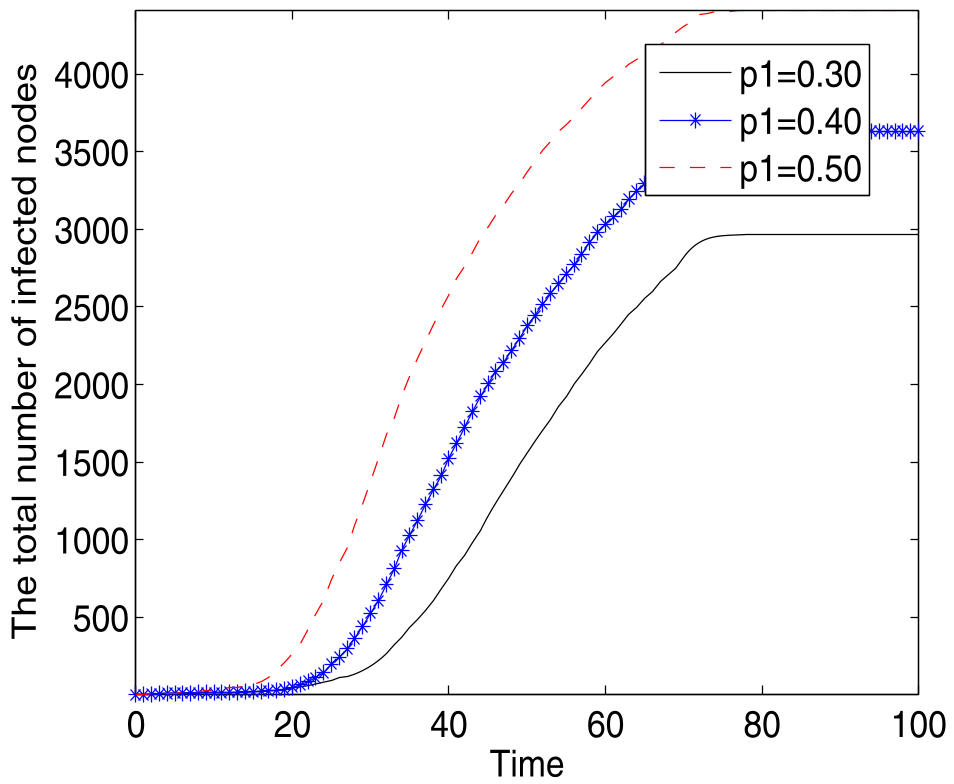 Fig 2: Growth and decay of infected nodes over time under different infection probabilities ().
One of the key findings is the "Threshold Effect": if the calculated Infection Degree () does not exceed a certain transmission threshold (), the spread can be effectively halted, even if the node is socially active.
Critical Insight & Conclusion
Why this matters
This work provides a mathematical bridge between Social Network Analysis (SNA) and Cybersecurity. By knowing the social graph, network providers can identify "high-risk hubs" and apply patches or warnings specifically to those users, rather than the entire network.
Limitations & Future Work
While the model is robust for SMS/MMS, modern malware often uses hybrid approaches (Bluetooth + WiFi + Social Media). The authors acknowledge that the next step is incorporating Semi-Markov processes to handle the uncertainty and complexity of multi-vector (hybrid) propagation and the impact of "vaccination" (security updates).
In conclusion, the social relationships we maintain through our phones are the very paths hackers exploit. Understanding the topology of these relationships is our best defense in predicting the next mobile pandemic.