
Urban Data Cartography: From Grid Density to Topological Networks
Different Models to Visualise Geolocated City Data from Social Networks
This paper presents and compares three distinct models for visualising geolocated social network data from Google Places and Foursquare. The methodologies range from Euclidean geometry-based approaches like Global Grids and Nearest Neighbour queries to a novel Topology-based "Urban Network" model that maps data onto the city's physical street infrastructure.
TL;DR
The explosion of geolocated social media data provides a digital heartbeat of modern cities. This paper explores three ways to visualize this "informational city": traditional Global Grids, Nearest Neighbour proximity queries, and a sophisticated Urban Network approach. By moving beyond simple heatmaps and treating the city as a topological graph, researchers can better understand how the physical layout of streets dictates the flow and concentration of social activity.
The Visualization Challenge: Spatial vs. Topological
Existing geographical information systems (GIS) often treat data points as isolated entities on a 2D plane. However, human activity is constrained by urban design—people walk along streets and congregate at intersections. The core motivation of this study is to move beyond "blanket" visualizations and find models that integrate social data into the actual skeleton of the city.
Methodology: Three Lenses for City Data
1. Global Grid Model (The Raster Approach)
This model divides the study area into uniform square cells. There are two variants:
- Simple Grid: Color intensity is based purely on the count of data points per cell.
- Bilinear Interpolation: Values are assigned to cell vertices, creating a smoother gradient that reduces the "pixelated" look of the data.
2. Nearest Neighbour Query (The Point Approach)
Based on Tobler’s First Law of Geography—"near things are more related than distant things"—this model creates a local reference system for every data point. It calculates density within a radius (), making it excellent for pinpointing specific "hotspots" without the arbitrary boundaries of a grid.
3. Urban Network Model (The Topological Approach)
This is the paper’s most advanced offering. Instead of abstract squares, it uses the Primal Graph of the city.
- Edges: Represent streets.
- Nodes: Represent intersections.
- Polygons: Represent city blocks (faces of the graph).
Data points are assigned to the nearest nodes of the street network. This transforms a map into a mathematical graph, allowing researchers to use network theory to analyze urban dynamics.
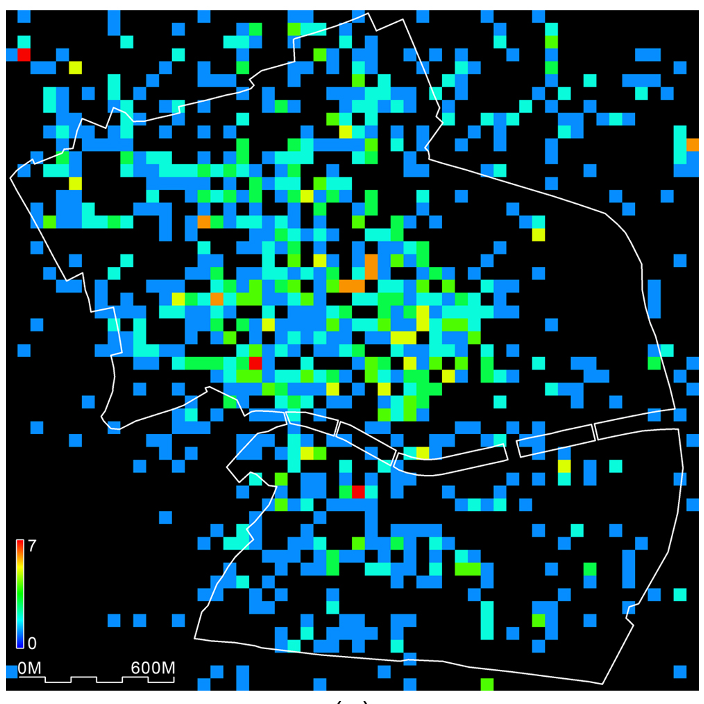 Fig 4: Left shows the point geolocations; Right demonstrates how data is associated with specific nodes in the urban primal graph.
Experiments: Examining Murcia, Spain
The authors tested these models using data from Google Places (commercial activity) and Foursquare (social check-ins) in the historic center of Murcia.
- Grid Size: 50m x 50m cells.
- Radius (r): 50m for Nearest Neighbour.
- Data Count: Over 7,700 points total.
Key Findings
- Visual Fidelity: The Nearest Neighbour model provides the most accurate spatial representation but is computationally expensive for massive datasets.
- Computational Efficiency: The Grid model is the fastest for searching and managing large volumes of data due to its uniform structure.
- Structural Insight: Only the Network-based model reveals how the topology of the city (e.g., narrow street vs. main square) affects the concentration of social media mentions.
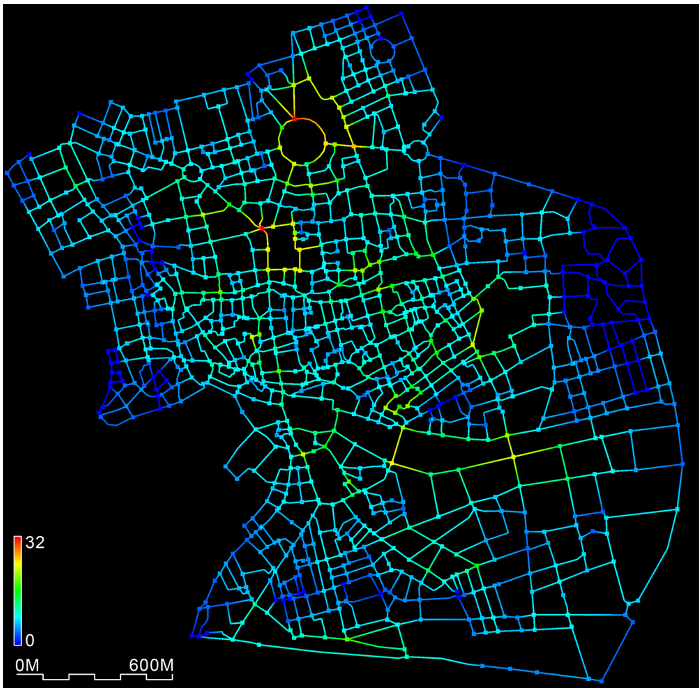 Fig 5: Comparison of grid-based visualization versus the urban pattern-based visualization for Foursquare and Google Places data.
Critical Insight & Conclusion
This paper highlights a critical transition in urban data science: moving from visualisation for presentation to visualisation for exploration.
While the Grid and Nearest Neighbour models are superior for "quick-look" heatmaps, the Urban Network model is the bridge to advanced urban analytics. By mapping data to a graph, we can calculate node centrality, "betweenness," and flow, essentially turning a static map into a functional model of urban life.
Limitations: The Network model depends heavily on the quality of the street discretisation. If the base map is inaccurate, the topological data assignment becomes misleading. Future work should look at integrating dynamic, time-series data to see how these network "hotspots" shift from day to night.