
Digital Footprints as a Proxy for Public Health: Mobility Estimation via Twitter
Multi-scale population and mobility estimation with geo-tagged Tweets
This paper explores using geo-tagged Tweets as a proxy for multi-scale population and mobility estimation in Australia. By analyzing 6.3 million tweets, the authors validate that Twitter-derived data correlates strongly with census population and that the Gravity Model outperforms the Radiation Model in predicting Australian mobility flows.
TL;DR
Researchers from CSIRO have demonstrated that geo-tagged Tweets are a powerful, real-time proxy for tracking human mobility and population distribution in Australia. By analyzing millions of tweets across different geographic scales, they found that the classical Gravity Model significantly outperforms the more modern Radiation Model in predicting how Australians move—a finding that challenges recent academic consensus and provides a blueprint for responsive disease-spread modeling.
Context & Motivation: The Need for Speed in Epidemics
When an outbreak like Ebola or Dengue occurs, timing is everything. Traditional models rely on Census data, which is often years out of date, or Mobile Phone Logs (CDRs), which are difficult to access due to strict privacy regulations.
The authors' insight is simple yet profound: Social media is a voluntary, real-time sensor of human presence. If we can prove that the way people tweet reflects the way they move and live, we can build a "living map" for epidemiologists that updates every second, not every decade.
Methodology: Testing the "Universal" Laws of Mobility
The study utilizes over 6.3 million geo-tagged tweets from nearly 474,000 unique users in Australia. To validate the data's utility, the authors tested two primary mathematical frameworks for mobility:
- The Gravity Model: Suggests mobility is proportional to the population of two locations and inversely proportional to the distance between them (analogous to Newtonian physics).
- The Radiation Model: A newer model suggesting that travel is determined by "intervening opportunities"—the population density between the start and end points.
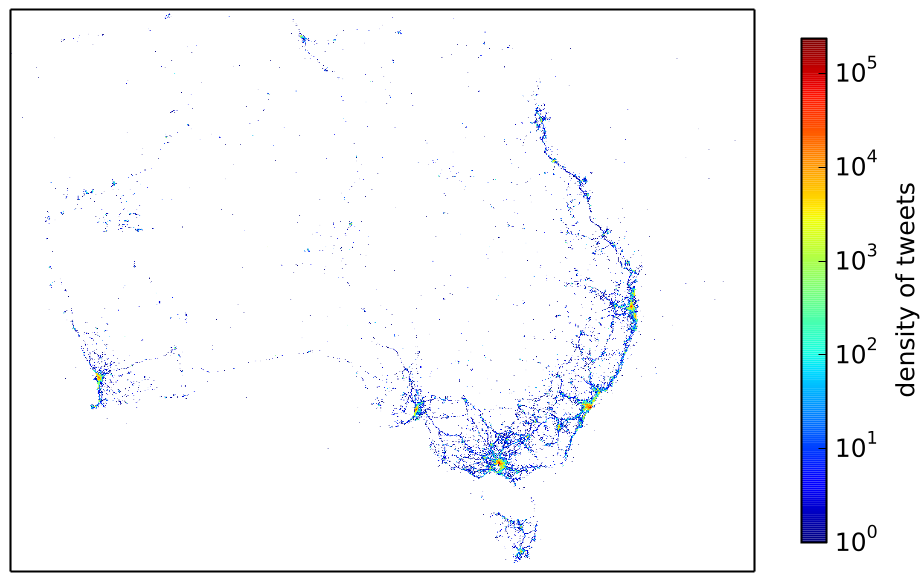 Fig 1. Visualization of geo-tagged Tweets highlighting Australia’s most dense areas, closely resembling its real-world population distribution.
Key Findings: Why the "Universal" Model Failed
The most striking result of the study is the failure of the Radiation Model in the Australian context. While previous high-profile studies (e.g., in the US) suggested the Radiation Model was superior, the CSIRO team found the opposite.
1. Robust Population Correlation
The correlation between "Twitter population" and census data was remarkably high (Pearson = 0.816). Even at the metropolitan level (suburbs of Sydney), the data held up, although it became more sensitive to the "search radius" used to define an area.
2. Gravity Wins in Sparse Landmasses
Quantitative metrics showed the Gravity Model (specifically the 2-parameter version) was much more accurate across all scales.
- National Scale: Gravity 2-Param (0.912 correlation) vs. Radiation (0.840).
- Metropolitan Scale: Gravity 2-Param (0.963 correlation) vs. Radiation (0.918).
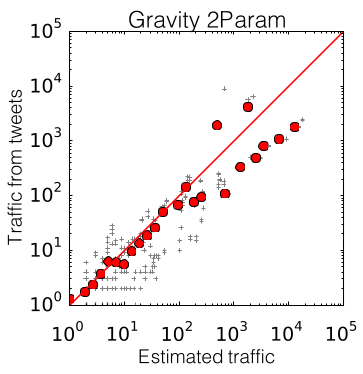 Fig 2. Scatter plots showing the fit of Gravity vs. Radiation models. Note how Gravity (top) stays tighter to the red 'identity' line than Radiation (bottom).
Why did Radiation fail?
The authors posit that the Radiation Model assumes a smooth decay in population density. In Australia, the population is heavily concentrated on the coast with vast, empty interiors. This "sparseness" violates the underlying assumptions of the Radiation Model, whereas the Gravity Model's focus on raw distance and mass proved more resilient.
Critical Insight: The Future of Responsive Modeling
This paper serves as a critical reminder that geographic context matters. A "universal" model developed using data from the densely populated Northern Hemisphere may not apply to the unique spatial footprints of the Southern Hemisphere or other sparsely populated regions.
Takeaway for Practitioners: Research indicates that geo-tagged social media data is no longer just a "noisy" signal—it is a robust tool for estimating population flow. For developers and public health officials, this means that integrating Twitter API data (or similar platforms) into early-warning systems for infectious diseases is not just feasible, but potentially more accurate than using outdated official statistics.
Limitations & Future Work
The study admits to sampling bias (Twitter users are not a perfectly representative demographic of the entire population). Future research aims to integrate higher-resolution census data and evaluate the models in different countries to further refine the "laws" of human mobility in the digital age.