
Beyond the Polls: How CVAR and Social Multimedia Predict the Future of Politics
A Multifaceted Approach to Social Multimedia-Based Prediction of Elections
The paper introduces the Competitive Vector Auto-Regression (CVAR) model for election forecasting by integrating real-world polling data with multifaceted social multimedia from Flickr. It leverages textual metadata, viewer comments, and visual sentiment analysis to achieve state-of-the-art predictive accuracy for the 2012 US Presidential Election and the 2014 House Race.
TL;DR
Predicting elections has traditionally relied on expensive polling or noisy Twitter sentiment. This paper introduces Competitive Vector Auto-Regression (CVAR), a model that fuses real-world polls with multifaceted signals from Flickr. By analyzing not just what people say, but the images they share and how viewers react, CVAR achieves unprecedented accuracy in predicting US Presidential and House races, proving that in the digital age, a social image may truly be worth a thousand votes.
Background: The Crisis of Traditional Polling
Political forecasting is at a crossroads. Traditional opinion polls are increasingly criticized for sampling bias and escalating costs. Meanwhile, the first generation of social media "big data" analytics—mostly focused on Twitter—has often failed, producing results no better than chance due to bots and superficial engagement. The authors posit that Flickr offers a better proxy for the voting population because uploading and commenting on high-quality images requires more cognitive "investment" than a fleeting 140-character tweet.
Methodology: Fusing Multi-modal Signals with Competitive Constraints
1. The CVAR Framework
Standard Vector Auto-Regression (VAR) is excellent at capturing how different variables (like poll numbers and social media mentions) correlate over time. However, it doesn't know that politics is a zero-sum game.
The Competitive VAR (CVAR) model introduces specific mathematical constraints:
- Sum-to-One Constraint: Ensures the support rates of competing candidates always aggregate to 100%.
- Influence Priority: It encodes the prior knowledge that signals related to "Candidate A" should have a stronger impact on A’s predicted support than B’s.
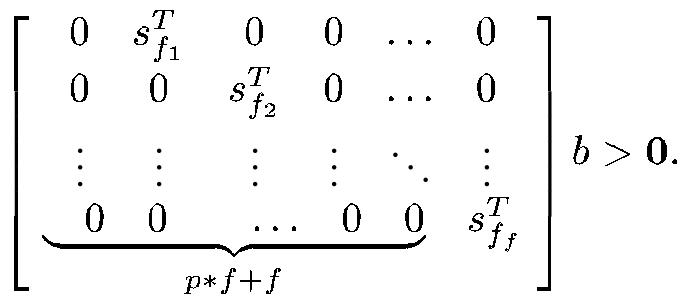 The CVAR optimization problem uses quadratic convex programming to find the best-fit coefficients while respecting these competitive boundaries.
2. Multifaceted Features: The Power of Social Multimedia
The model doesn't just count images; it "looks" at them. The authors extract three layers of information:
- Visual Sentiment: Using facial feature extraction (Stasm) and an Adaboost classifier to label images of candidates as "flattering" or "unflattering."
- Metadata Sentiment: Analyzing the owner's description and tags.
- The Viewer Factor: Using Sentiment140 to analyze the tone of viewer comments, which captures the "magnifying effect" of public opinion.
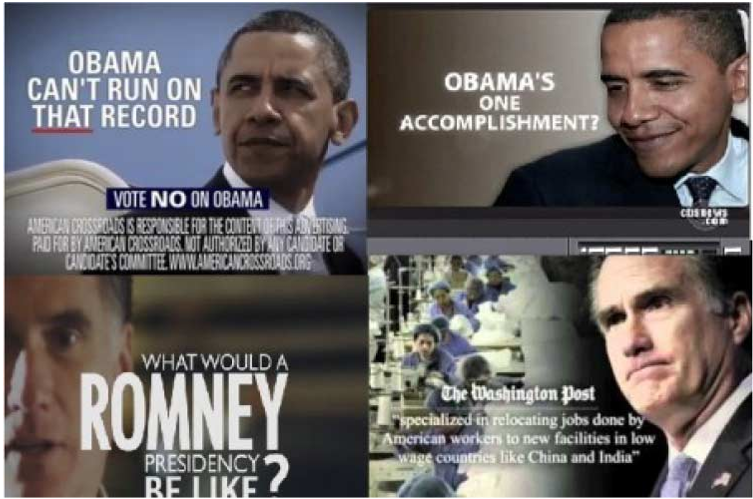 Figure 1: Examples of how visual content (facial expressions) and viewer comments provide contrasting sentiment signals.
Experiments: Dominating the Swing States
The researchers tested CVAR against standard AR (Auto-Regressive) and VAR models using data from the 2012 US election.
Key Findings:
- National Accuracy: On Election Day, CVAR’s prediction for Obama vs. Romney was nearly identical to the actual polling average.
- The Swing State Test: This is where CVAR shined. While Twitter-based models famously miscalled "red states" (like Texas) as "blue," CVAR correctly predicted the winner in all eight major swing states, including Florida and Ohio.
- Stability: As seen in the House Race experiments, standard VAR models often "break" (become unstable) when you add too many features. CVAR remained robust because its competition mechanism acts as a regularizer.
| State | Official (Obama) | CVAR (Obama) | VAR (Obama) |
|---|---|---|---|
| Florida (FL) | 0.5044 | 0.5018 | 0.4917 |
| Ohio (OH) | 0.5098 | 0.5120 | 0.5105 |
| Iowa (IA) | 0.5287 | 0.5291 | 0.5153 |
Critical Insight: Why Does It Work?
The effectiveness of CVAR stems from its ability to separate Signal from Noise.
- Contextual Weighting: Vice-presidential candidates, for instance, were found to have a high influence temporarily (after debates) but faded over time—CVAR’s lag coefficients correctly captured this decay.
- Multimodality as Calibration: Textual data might be sarcastic or keyword-stuffed, but visual sentiment (e.g., a candidate looking exhausted or aggressive in a viral photo) often reveals a deeper, subconscious public perception.
Conclusion and Future Outlook
This work marks a significant shift from "Social Media Counting" to "Social Multimedia Understanding." By combining the mathematical rigor of macro-economic models (VAR) with the nuanced insights of computer vision, the authors have built a framework that is significantly more resistant to the biases of specific platforms.
Limitations: The model is still dependent on the availability of geo-tagged data for state-level accuracy, which remains sparse. Future iterations integrating modern Large Language Models (LLMs) to better understand complex political sarcasm in comments could push the accuracy even further.
Takeaway for Researchers: When modeling competitive environments, don't just feed raw data into a regression. Enforce the competition through model constraints to achieve true stability.