
Multiple Images of the City: How Who You Are Shapes How You See the Streets
Multiple Images of the City: Unveiling Group-Specific Urban Perceptions through a Crowdsourcing Game
2017-06-28
Summary
Problem
Method
Results
Takeaways
Abstract
This paper introduces a crowdsourcing methodology to analyze urban perceptions of safety and pleasantness in a mid-sized Brazilian city. By combining human extraction of high-level urban design elements with sociodemographic data, the authors developed machine learning models that significantly outperform standard baselines in predicting group-specific urban preferences.
## Executive Summary
**TL;DR**: Researchers have moved beyond "average" city rankings to uncover how different demographic groups perceive safety and beauty differently. By using a crowdsourcing game in Campina Grande, Brazil, this study proves that high-level urban elements (like trees and traffic) are filtered through the lens of a resident’s age, gender, and income.
**Background**: This work sits at the intersection of **Urban Informatics** and **Environmental Psychology**. While previous "Place Pulse" studies focused on global rankings using raw pixels, this paper bridges the gap to **Urban Sociology** by proving that the "image of the city" is actually a collection of subjective "images" held by different social groups.
## The Problem: The "Average" Citizen is a Myth
Urban planners often rely on general sentiment, but a street that feels "open and safe" to a young man might feel "exposed and dangerous" to an elderly woman. Most computational models treat urban perception as a computer vision task—identifying colors and shapes—while ignoring the **Inductive Bias** created by a person's life experience.
The authors argue that we need to understand the *Why* (the urban elements) and the *Who* (the sociodemographic moderators) to build truly inclusive cities.
## Methodology: Marrying Urban Design with Big Data
The researchers employed a three-tier data collection strategy:
1. **The Game**: A "How is Campina Like?" web app where users compared 4 images at once to rank safety and pleasantness.
2. **The Features**: Instead of just using RGB values, they used workers to identify 31 high-level elements based on **Ewing and Clemente’s** urban design metrics.
3. **The Logic**: They used logistic regression with **Random Effects** to account for individual variability, treating sociodemographics as "moderators" that tilt the importance of specific physical features.
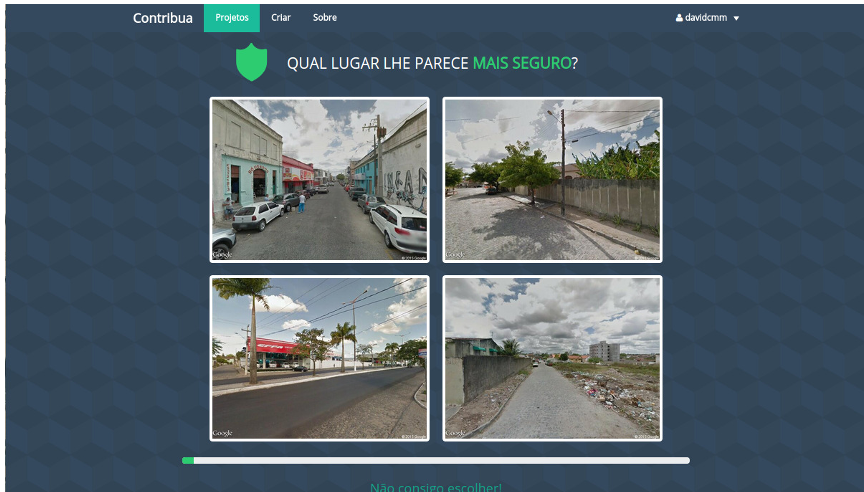
*Figure 1: The MaxDiff interface used to gather high-density preference data.*
## Key Insights: Cars, Trees, and The Social Lens
The findings revealed fascinating cultural and demographic nuances:
* **The Positive Car Bias**: Unlike studies in the Global North, more cars were often associated with *higher* safety in Brazil. This reflects a car-oriented culture where traffic implies "eyes on the street" and social status.
* **Maintenance is King**: Thermal-mapped results show that "Maintenance Condition" is the strongest predictor for both safety and beauty across all groups.
* **The Demographic Tilt**:
* **Adults vs. Youth**: Older residents valued street width and trees significantly differently than younger ones.
* **Income Gap**: High-income individuals were much more sensitive to "physical disorder" (lack of maintenance) when judging a neighborhood.
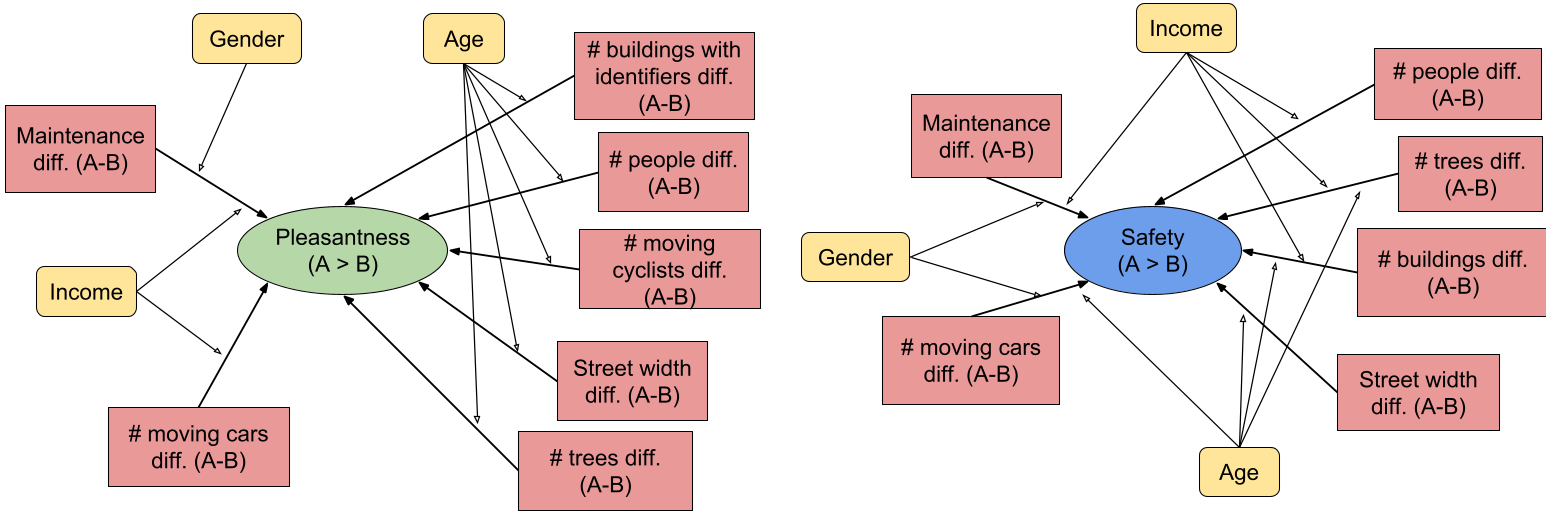
*Figure 2: Summary of significant moderations. Notice how Age and Income act as primary filters for physical elements.*
## Results: Solving the Cold-Start Problem
In recommendation systems, the "cold-start" problem occurs when a new user joins and we know nothing about them. The study showed that by simply knowing a user's **Age, Gender, and Income**, a model could predict their street preferences with nearly **10% higher precision** than a model looking only at the images.
## Critical Analysis & Conclusion
**Takeaway**: This paper is a wake-up call for "Smart City" developers. Algorithms that suggest the "most beautiful route" or "safest path" cannot be one-size-fits-all; they must be personalized.
**Limitations**: The study relies on static **Google Street View** images. As the authors note, perception changes with time of day, noise, and smell—factors a static image cannot capture. Furthermore, the "Car Bias" found in Brazil might not generalize to pedestrian-heavy European cities.
**Future Outlook**: The next step is "Deep Urban Perception"—using Neural Networks to automatically detect these 31 urban design elements across millions of images, allowing for real-time, personalized urban planning at a global scale.