
Symphonies in Color: Bridging Musical Emotion and Visual Art via Machine Learning
Music Emotion Visualization through Colour
This paper presents a computational framework for mapping musical segments to specific colors based on emotional content. By utilizing the DEAM dataset and a Random Forest regression model, the authors predict "Arousal" and "Valence" scores which are then translated into RGB values using an adapted Itten’s color wheel.
TL;DR
Can we "see" the sadness in a cello suite or the energy of a rock anthem? This research leverages the DEAM dataset and Random Forest regression to map music to the Valence-Arousal emotional plane. By projecting these emotional coordinates onto a modified Itten’s color wheel, the authors provide a mathematical framework for automated, emotionally-synced music visualization.
The Problem: The "Feeling" Gap in Visualization
Most traditional music visualizers (like those in old media players) are reactive: they change size or color based on volume or frequency. While visually stimulating, they lack emotional intelligence.
The challenge in solving this is two-fold:
- Subjectivity: Emotion is hard to quantify.
- Data Scarcity: There are very few datasets that combine high-quality audio with gold-standard emotional annotations.
The Research Intuition
The authors realized that Mathematics is the common language between music and visual arts. By using Russell’s Circumplex Model of Affect—which plots emotions on a 2D graph of Arousal (energy) and Valence (pleasure)—they created a target coordinate system. To turn these coordinates into color, they utilized Itten’s Color Theory, essentially treating the emotional state of a song as a vector pointing to a specific hue.
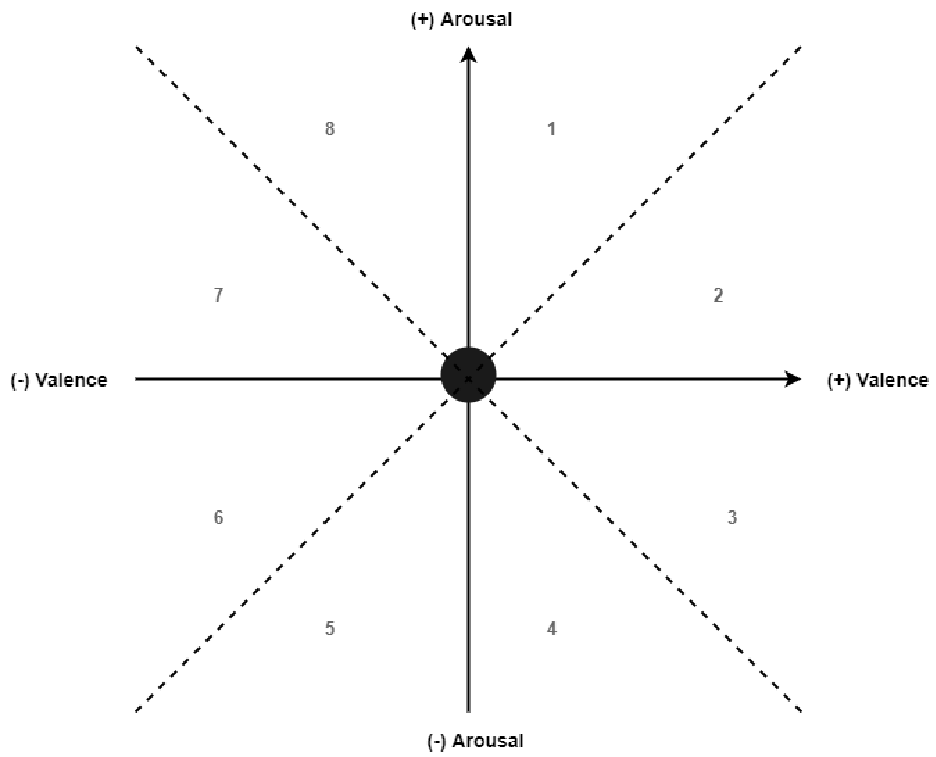 Figure 1: Russell's model serves as the emotional foundation of the study.
Methodology: From Waves to Wagners
The technical pipeline follows a robust four-step process:
- Feature Extraction: Using the JAudio tool, the team extracted 72 acoustic dimensions, including Spectral Centroid, Root Mean Square (RMS), and MFCCs (Mel-frequency cepstral coefficients).
- Regression Modeling: They tested seven different classifiers in WEKA. The Random Forest algorithm emerged as the winner, particularly for Arousal (R=0.81). Predictably, Valence (R=0.60) remained more elusive, reflecting a known difficulty in the field where "pleasantness" is harder to detect from raw audio than "energy."
- Cross-Modal Mapping: The predicted V-A values were mapped to a coordinate system where (0,0) represents neutral white, red/orange represent high arousal (excitement/anger), and blue/green represent low arousal (sadness/calm).
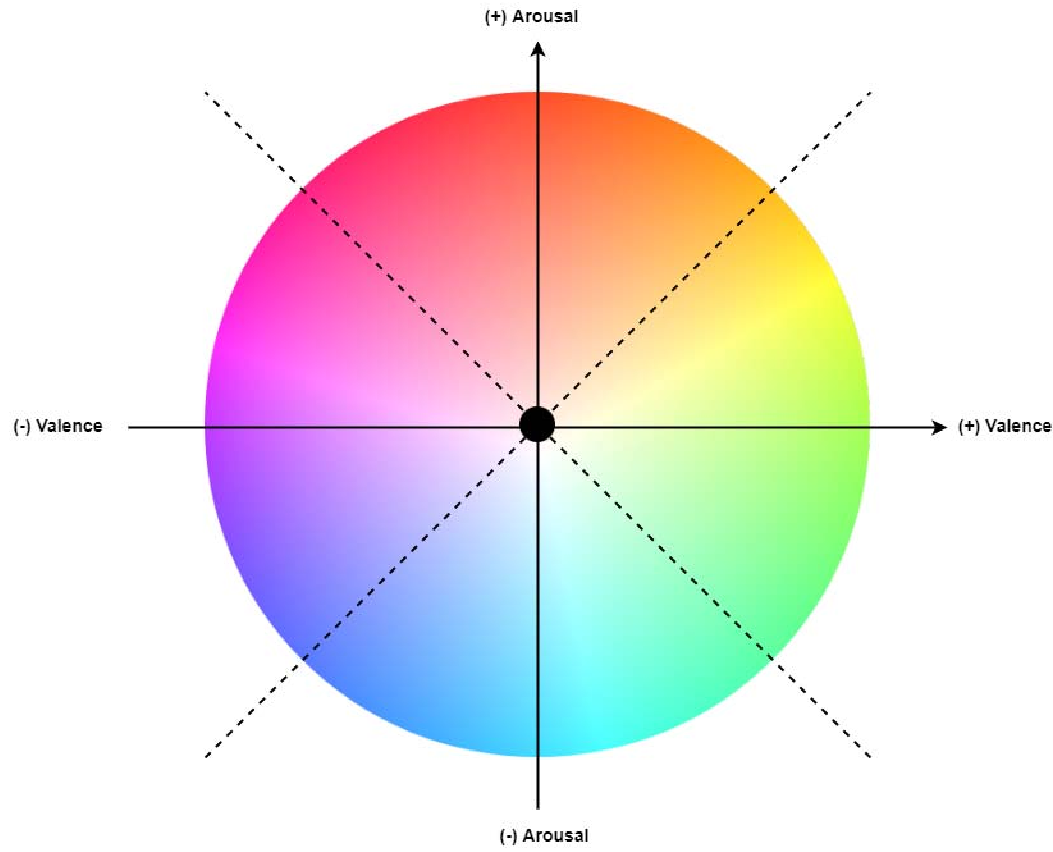 Figure 2: The bridge between psychology (Russell) and art theory (Itten).
Key Results & Evidence
The study evaluated several global hits and regional tracks. For example:
- "The Final Countdown" (Europe): Resulted in a high-arousal, reddish-pink (RGB: 250, 141, 141), aligning with its energetic nature.
- "My Immortal" (Evanescence): Predicted as low arousal and negative valence, resulting in a somber lavender/blue (RGB: 202, 166, 225).
| Classifier | Arousal (R) | Valence (R) |
|---|---|---|
| Random Forest | 0.817 | 0.602 |
| Linear Regression | 0.810 | 0.575 |
| Multi-layer Perceptron | 0.811 | 0.558 |
| Decision Stump | 0.580 | 0.377 |
Note: The Random Forest model provided the most reliable results across both dimensions.
Critical Analysis & Future Outlook
The beauty of this work lies in its simplicity and grounding in art theory. By not trying to "reinvent the wheel" and instead connecting two established models (Russell and Itten), the authors created a system that feels intuitively correct to human observers.
Limitations:
- Cultural Bias: The color-emotion mapping (e.g., red for high arousal) is largely based on Western psychological studies. Different cultures may perceive these links differently.
- Valence Accuracy: The 60% accuracy for Valence suggests that spectral features alone aren't enough; perhaps lyrical analysis or complex harmonic features are needed.
The Road Ahead: The authors plan to move beyond static colors to generative shapes (Fractal Arts). Imagine a system where the music not only chooses the paint but also drives the brushstrokes of a digital masterpiece in real-time.
Takeaway
This paper is a significant milestone for Affective Computing in the arts. It proves that with the right psychological bridge, machine learning can move beyond mere pattern recognition and start understanding the "vibe" of human creativity.