
Decoding the DNA of Deviance: A Unified Typology of Data Anomalies
On the nature and types of anomalies: a review of deviations in data
This paper presents the first theoretically principled and domain-independent typology of data anomalies, moving beyond the "vague" and domain-specific definitions that have persisted for 250 years. By utilizing five data-centric dimensions, the author identifies 3 broad groups, 9 basic types, and 63 specific subtypes of anomalies across various data structures like time series, graphs, and spatial data.
TL;DR
Despite 250 years of research starting with Bernoulli, the concept of an "anomaly" has remained frustratingly vague and domain-dependent. Ralph Foorthuis’s landmark paper, On the Nature and Types of Anomalies, finally provides a "Periodic Table" for deviance. By mapping anomalies across five data-centric dimensions, the author identifies 63 distinct subtypes, transforming Anomaly Detection from a black-box guessing game into a rigorous science of Anomaly Analysis.
The "Vagueness" Problem: Why We Struggle with Outliers
In modern data science, we often treat anomalies as "noise to be removed" or "signals to be caught," but we rarely ask what they are at a fundamental level. Prior work often conflated the cause of an anomaly (e.g., a sensor error) with its manifestation (e.g., a spike). This lack of a formal taxonomy has led to:
- Algorithmic Mismatch: Using a tool designed for "global outliers" to find "local density shifts" (and failing).
- Interpretability Gaps: Being unable to explain why a case was flagged in a way that makes business sense.
Methodology: The Five Dimensions of Deviance
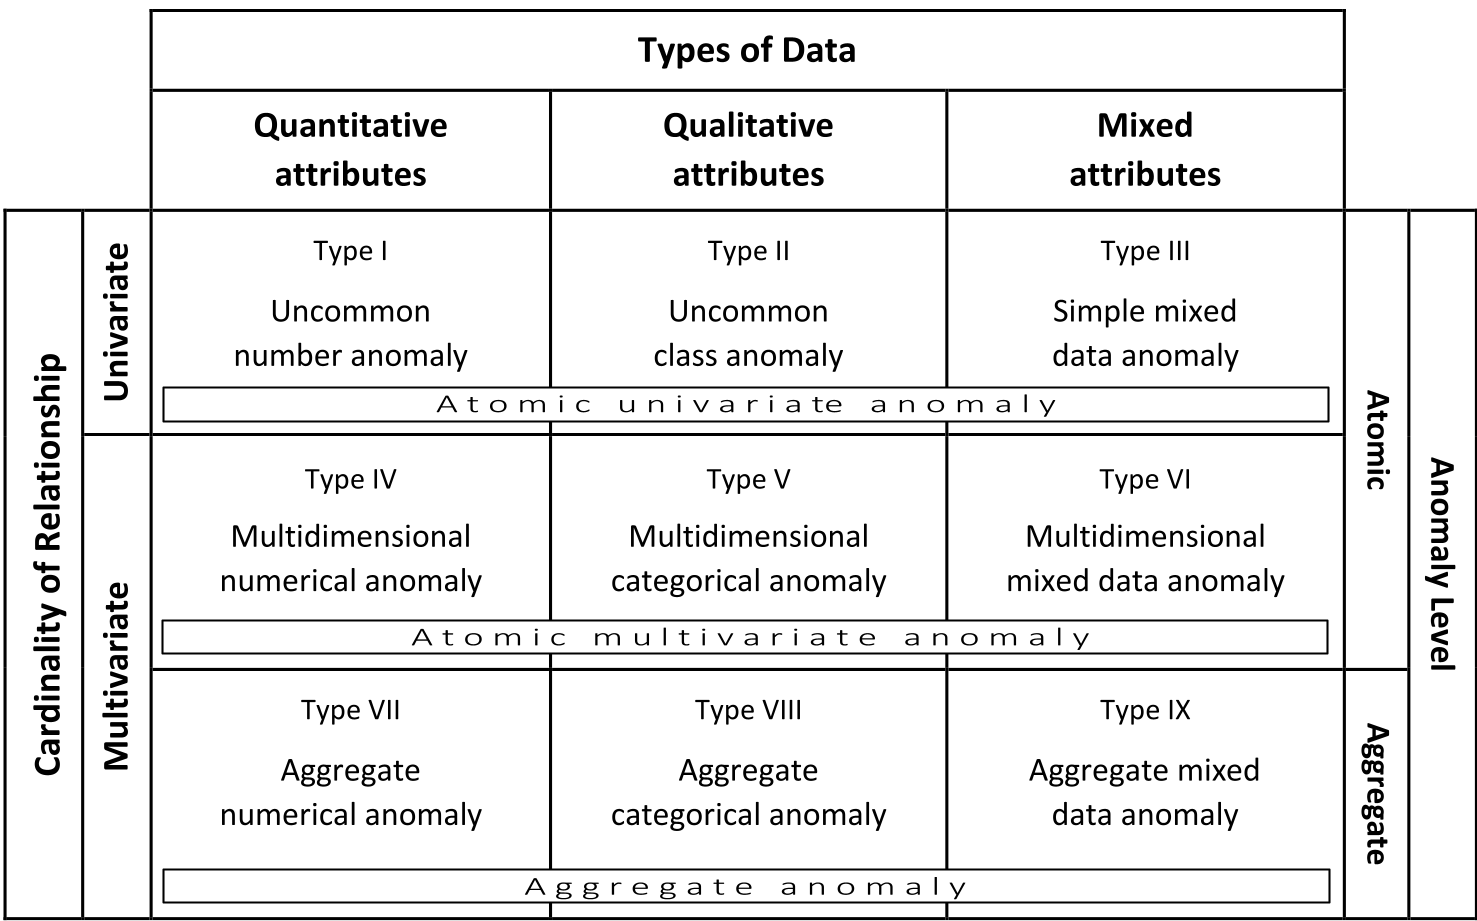
Foorthuis proposes that any anomaly can be defined by its position in a 5-dimensional coordinate system of data properties:
- Data Type: Is the deviance in the numbers (Quantitative), the categories (Qualitative), or a mix?
- Cardinality: Does the anomaly show up in a single variable (Univariate) or only in the interaction between variables (Multivariate)?
- Anomaly Level: Is it a single "weird" point (Atomic) or a "weird" group of points (Aggregate)?
- Data Structure: How is the data stored? (Think: Tables, Time Series, Graphs, or Spatial Grids).
- Data Distribution: How does the anomaly relate to the density and dispersion of the "normal" population?
Visualization of the Typology Framework
The core of this work is the 3x3 matrix of basic types, which then branches out into 63 specialized subtypes.
Deep Dive: From Atomic Spikes to Collective Shifts
The paper breaks anomalies into three broad families:
1. Atomic Univariate (The Low-Hanging Fruit)
These are individual records with a value that is simply "impossible" or "extremely rare" on its own.
- Example: A person’s age recorded as 246 years.
- Subtype Note: ST-Ia (Extreme Tail Value) is the classic outlier we all know.
2. Atomic Multivariate (The Hidden Deviants)
These records look perfectly normal if you check each column one by one, but they are "impossible" in combination.
- Example: A 10-year-old child who is 180cm tall. Both age and height are "normal," but the combination is a Type IV (Multidimensional Numerical Anomaly).
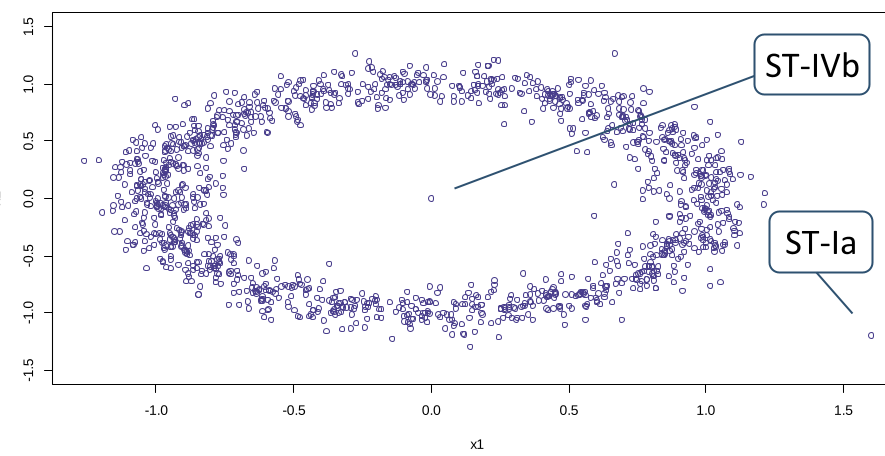 In the figure above, Type IVb (Enclosed Point) shows an anomaly hiding inside a normal distribution, undetectable by standard range-based methods.
3. Aggregate Anomalies (The Complex Patterns)
These are the most difficult to detect. No single data point is necessarily "wrong," but the sequence or group is off.
- Time Series Example: A Level Shift (ST-VIIc) where a sensor suddenly jumps to a new baseline.
- Graph Example: A Deviant Subgraph (ST-VIIIb) where a community of users relates to each other in a way that departs from the network norm.
Experimental Insight: Testing the "No Free Lunch" Theorem
Foorthuis demonstrates that no single algorithm can catch every type.
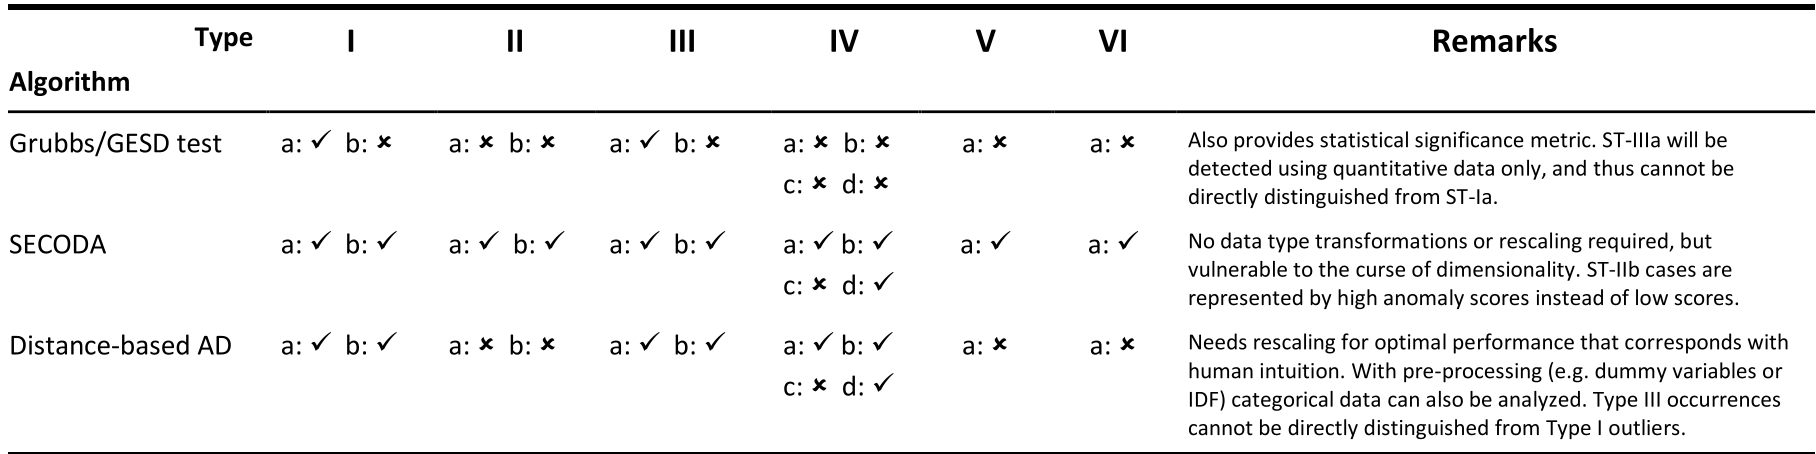 For instance, the Grubbs Test (a statistical staple) is excellent at catching extreme tail values (Type I) but is completely blind to multivariate combinations (Type IV) or categorical rare classes (Type II).
Critical Insight: AAAD (Anomaly Analysis and Detection)
The paper’s most significant contribution to the industry is the shift toward Explainable Anomaly Detection. By identifying which of the 63 subtypes an algorithm has triggered, practitioners can:
- Automate Cleaning: Use simple thresholds for Type I, but use complex rules for Type VI.
- Scientific Discovery: In astronomy (like the erratic light-dimming of star KIC 8462852), identifying a Deviant Shape Sequence (ST-IXf) is what led to theories about alien megastructures (Dyson Spheres).
Conclusion & Future Outlook
Foorthuis has successfully moved the goalposts for the field. By providing a common language (The Typology), we can now build more transparent, robust, and specialized detection systems. The next frontier? Extending this logic to Concept Drift—detecting when "normal" itself is changing over time.
If you are a practitioner, your next step shouldn't be "getting a better algorithm," but rather "mapping your anomalies" to see which of the 63 subtypes actually matter for your business.