
Networked Healing: How Provider Collaboration Shapes Healthcare Efficiency
Application of network analysis on healthcare
This paper presents a Social Network Analysis (SNA) approach to model professional collaborations in healthcare using Australian private health insurance claims. Specifically, it introduces a tripartite collaboration model between surgeons, anaesthetists, and assistants to quantify the impact of network topology on treatment costs and quality of care.
TL;DR
Is the secret to better healthcare hidden in the "social graph" of doctors? This paper analyzes over 59,000 Australian surgical claims to reveal that how surgeons collaborate with anaesthetists and assistants directly impacts patient recovery times and medical costs. By applying Social Network Analysis (SNA), the researchers found that decentralized, highly integrated teams outperform centralized "hub" structures, leading to lower complication rates and shorter hospital stays.
Problem & Motivation: Beyond the Patient File
In the typical healthcare analytics framework, researchers look at patient demographics, comorbidities, and hospital facilities. However, surgery is a "team sport." The authors argue that the structure of collaboration—the invisible web of relationships between surgeons, anaesthetists, and assistants—is a critical, yet often ignored, determinant of quality of care.
The core question was: Does a surgeon's "social position" in the medical community affect how fast their patients recover?
Methodology: Mapping the Tripartite Web
The researchers constructed two distinct network models using health insurance claims data:
- Collaboration Network (CN): A tripartite graph where nodes (surgeons, anaesthetists, assistants) are linked by shared hospital admissions.
- Surgeon-Centric Collaboration Network (SCCN): A zoomed-in view of an individual surgeon’s network, including the hospitals where they operate.
They measured "Centralization"—the extent to which a network revolves around a single player. A high Betweenness Centralization score indicates a "star" network where one or two people act as gatekeepers or hubs.
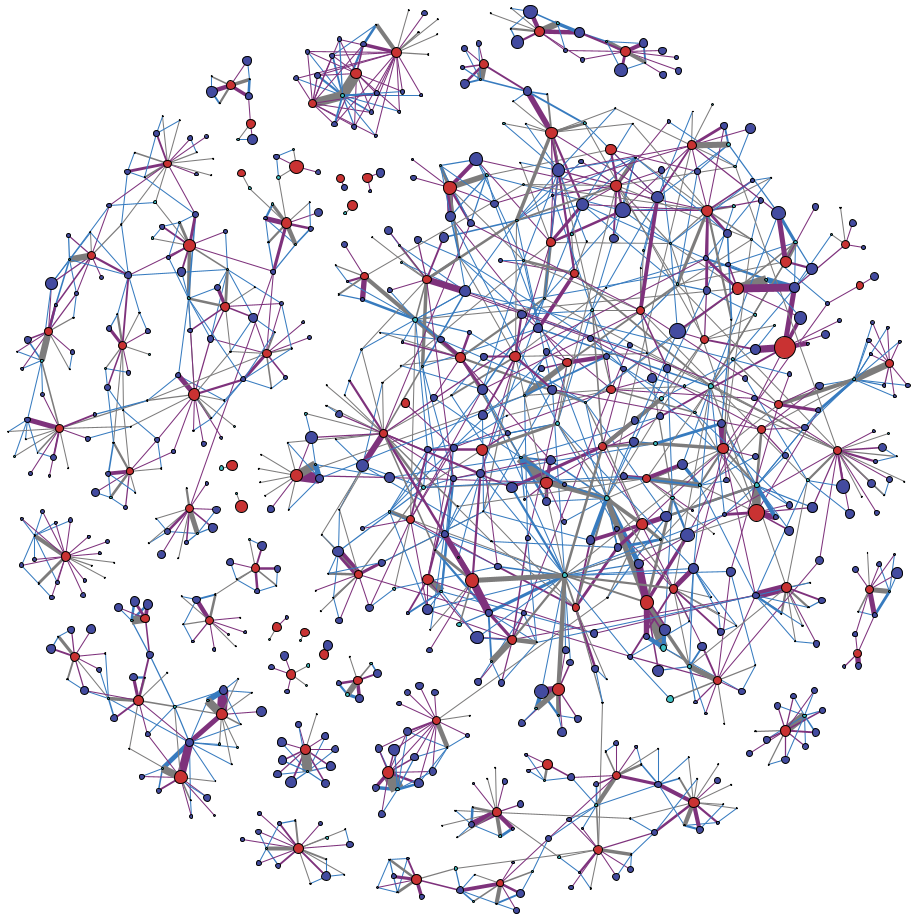 Fig 1: The tripartite collaboration graph. Red nodes are surgeons, blue are anaesthetists, and light blue are assistant surgeons. Edge thickness indicates the volume of shared cases.
Key Insights: The "Hub" vs. "Diversity" Effect
The study’s most striking findings came from comparing these network metrics against clinical outcomes like Length of Stay (LoS) and Complication Rates:
- The Hub Penalty: In SCCNs, high Betweenness Centralization was significantly linked to higher costs and longer LoS. This suggests that when a team's communication relies too heavily on a few central "hubs," it may lead to bottlenecks or reduced collective efficiency.
- The Triangle Benefit: Within the global network, surgeons with a high "Number of Triangles"—those who successfully collaborate within multiple distinct groups—consistently saw better results.
 Fig 2: SCCN variations showing different hospital engagement levels.
Experiments: Real-World Evidence
To validate their theories, the authors split surgeons into two groups based on their network integration (Group A: Low Triangles; Group B: High Triangles).
Across all categories of knee surgery, Group B (the high-diversity collaborators) consistently achieved shorter hospital stays. For instance, in complex Knee Revisions, Group B reduced the average LoS from 7.69 days to just 4.01 days—a massive improvement in both patient experience and hospital resource utilization.
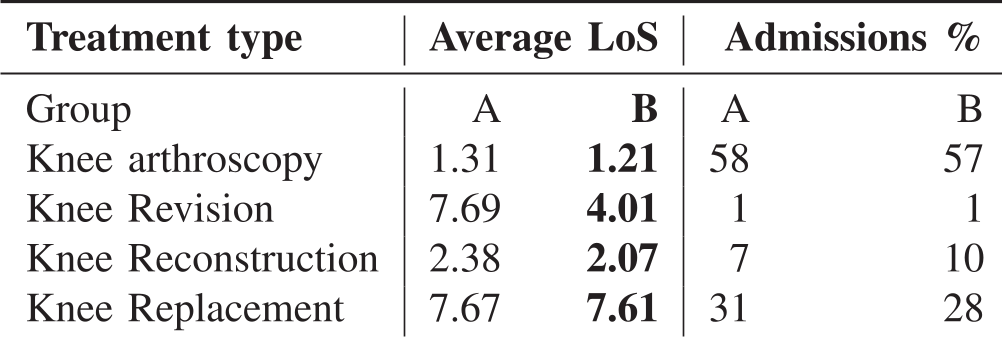 Table 1: Comparison of LoS between Group A (low network integration) and Group B (high network integration).
Critical Analysis & Conclusion
This research moves healthcare ROI from a purely clinical focus to an organizational one. The takeaway for hospital administrators is clear: Encourage team diversity.
Limitations: While the correlation is strong, the study is based on retrospective claims data. It cannot definitively prove why these structures work better—though the authors hypothesize "Social Learning" (cross-pollination of best practices) as the likely driver.
Future Outlook: In an era of "Big Data," using SNA to optimize surgical scheduling and team selection could be the next frontier in lowering the global cost of healthcare while simultaneously improving patient safety.