
Beyond Mutual Friends: Decoding Social Ties through Network Topology and Profile Inference
Network and profile based measures for user similarities on social networks
The paper introduces dual measures—Network Similarity and Profile Similarity—to quantify user closeness in Online Social Networks (OSNs). It proposes a novel graph metric that accounts for indirect connection density and a profile inferral technique using majority voting among mutual friends to address missing data.
TL;DR
Link prediction in social networks usually relies on a simple count of mutual friends. This paper argues that the density of the connections between those friends is a far stronger signal. By combining this "Mutual Friends Graph" approach with an automated technique to infer missing profile data (like hometown or education) from social circles, the authors achieve superior accuracy in forecasting new relationships on platforms like Facebook and DBLP.
Problem & Motivation: The "Sparse vs. Dense" Trap
Traditional metrics like Cosine similarity or L1 Norm view mutual friends as an unordered set. However, in the real world, if User A and User B share three friends who are all best friends with each other, they are much more likely to connect than if those three friends are strangers to one another.
Furthermore, the "Missing Data" problem is rampant. On Facebook, roughly 64% of profile attributes are hidden or unentered. This makes semantic similarity (e.g., "do these two people like the same movies?") nearly impossible to calculate for the majority of the graph.
Methodology: High-Definition Similarity
1. Network Similarity (The Topology Factor)
The core innovation is the Mutual Friends Graph (MFG). Instead of just counting nodes, the authors count the edges between those nodes.
- Physical Intuition: If binary "mutual friends" are the bricks, the MFG represents the mortar. A solid wall (dense connections) implies a stronger social pull than a pile of loose bricks.
- Normalization: To ensure the metric is fair for both social butterflies and introverts, the score is normalized using the log-ratio of the MFG edges against the target user's total friendship density.
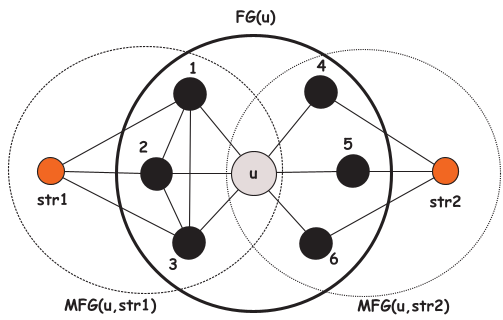 In the figure above, str1 is prioritized over str2 because str1's mutual friends are better connected to each other.
2. Profile Inference (The "Birds of a Feather" Insight)
To solve the missing data problem, the authors use Majority Voting. If 3 out of 5 mutual friends list "London" as their city, the system infers the stranger likely resides there too.
- Modularity Function: They don't just guess blindly; they optimize for precision using a threshold () and a minimum vote count ().
- Occurrence Frequency (OF): For comparing categories, they use weightings that account for how "rare" an attribute is. Sharing a rare hobby (e.g., Underwater Hockey) counts for more than sharing a common one (e.g., Reading).
Experimental Evidence: Predicting the Future
The authors tested their framework against massive real-world datasets:
Performance on Facebook
The Network Similarity (NS) measure was put in a "head-to-head" ranking battle against Cosine Similarity and PMI.
- Result: NS won significantly more often, particularly when similarity was either very low or very high, effectively filtering out noise that confuses simpler metrics.
| Metric Pair | Wins | Losses |
|---|---|---|
| NS vs. Cosine | 246,956 | 145,979 |
| NS vs. PMI | 206,732 | 168,963 |
The DBLP Co-authorship Study
By analyzing decades of research collaborations, the authors found a fascinating temporal split:
- Network strength determines when you will collaborate. High network similarity leads to collaborations within ~2 years.
- Profile similarity (shared research interests) determines if you will collaborate at all, often sustaining the potential for a link over 10-20 years.
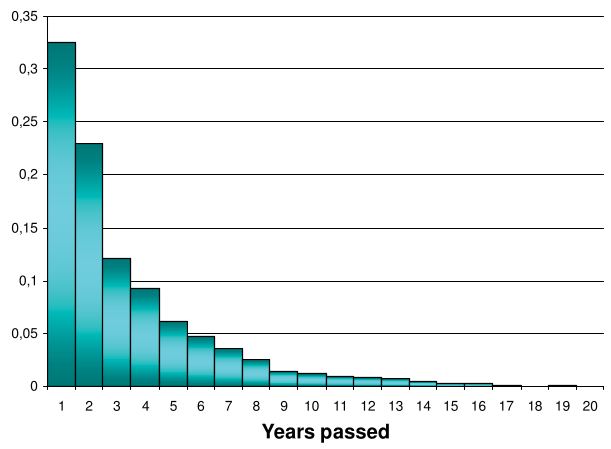 (a) Connection rates peak early; (b) Network similarity decays over time; (c) Profile similarity stays relevant long-term.
Critical Analysis & Conclusion
Takeaway
The paper confirms that local graph structure is the most potent predictor for short-term network evolution. It also proves that our "social shadow"—the data our friends reveal—can effectively fill in our own private or missing information for recommendation algorithms.
Limitations
The "Middle Section Anomaly" (where the measure performs slightly worse against PMI at similarity values around 0.45) suggests that for users with very few friends, the MFG might over-inflate the importance of a single tight-knit cluster. Furthermore, inferring multi-valued items (like "Work History") remains a challenge due to linguistic variations in how people enter text.
Future Outlook
This approach paves the way for privacy-preserving algorithms that can "guess" user needs without requiring them to fill out extensive profiles, but it also raises significant privacy concerns: your friends’ data can be used to mathematically "unmask" your own hidden attributes.