
Decoding the Aging Brain: A Unified Machine Learning Approach to Neuroimaging Biomarkers
Neuroimaging biomarkers of cognitive decline in healthy older adults via unified learning
This paper presents a robust unified learning framework designed to identify neurological phenotypes of cognitive decline in healthy older adults. By integrating unsupervised clustering with feature selection and supervised classification, the authors discovered two distinct subgroups with unique patterns of white matter integrity and brain volume, achieving high classification accuracy (up to 98.6%).
TL;DR
Researchers have developed a unified machine learning framework to tackle the immense heterogeneity found in "healthy" cognitive aging. By analyzing brain volume (sMRI) and white matter integrity (qtdMRI), the model successfully clustered older adults into two distinct biological phenotypes—those with high versus low structural integrity—with a predictive accuracy of up to 98.6%.
Background: The Heterogeneity of Aging
Aging is not a uniform process. While some individuals maintain sharp cognitive function into their 90s, others experience a "suboptimal" trajectory that serves as a precursor to Alzheimer’s or other neurodegenerative diseases. The challenge for modern neuroscience is to identify objective biomarkers of these trajectories before clinical symptoms develop. Traditional methods often rely on subjective neuropsychological tests; this paper argues that the objective "truth" lies within the structural manifold of the brain itself.
Problem & Motivation: Beyond Localized Analysis
Most prior work focuses on specific, localized regions of interest (ROIs). However, brain aging is a systemic process affecting the connectivity and volume of diverse structures. The authors recognize that:
- High Dimensionality: Neuroimaging produces hundreds of features, often far exceeding the number of study participants (n=71 in this case).
- Noise and Redundancy: Many brain regions are highly correlated, which can bias unsupervised learning algorithms.
- Hidden Subgroups: "Healthy" is a broad label that masks underlying biological differences.
Methodology: The Unified Learning Framework
The paper introduces a pipeline designed to handle small, high-dimensional medical datasets through four rigorous stages.
Phase 1: Refining the Input
To prevent redundancy, a Correlation Filter Algorithm was applied. By removing features with pairwise Pearson correlations higher than a threshold (τ = 0.8 to 0.9), the authors ensured that the clustering was driven by truly independent biological signals.
Phase 2 & 3: Ensemble Learning and Feature Selection
Instead of relying on a single algorithm, the authors used an ensemble approach. For clustering, they employed K-means, K-medoids, and Hierarchical methods, validating the results with three indices: Silhouette (SI), Davies-Bouldin (DB), and Calinski-Harabasz (CH).
 Fig 1. The four-phase pipeline: Preprocessing, Ensemble Clustering, Feature Selection, and Prediction.
Key Findings & Results
The framework consistently split the cohort into two populous clusters.
- Cluster 1: "Optimal Agers" with higher brain volumes in the hippocampus, amygdala, and greater white matter integrity (Fractional Anisotropy) in the corpus callosum.
- Cluster 2: "Suboptimal Agers" showing significant structural decline. Interestingly, this group was older on average and had fewer years of education, suggesting a link between "Cognitive Reserve" (education) and structural preservation.
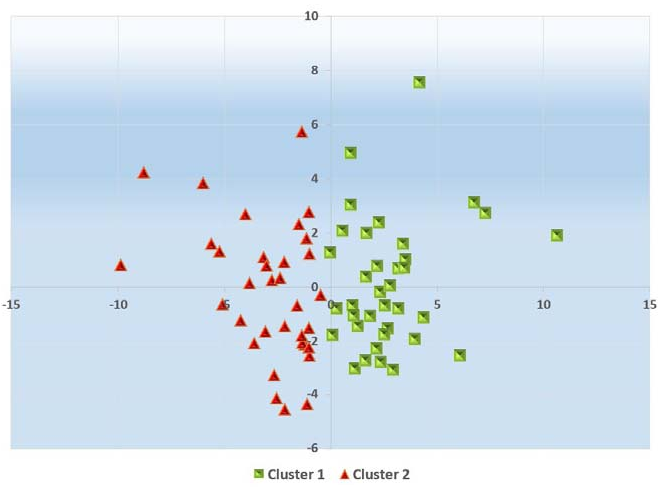 Fig 2. Visualization of multidimensional clusters showing the clear separation in neuroimaging space.
The Predictive Power of Biomarkers
Using the features identified (such as the volume of the Ventral Diencephalon and the integrity of the Superior Longitudinal Fasciculus), the Support Vector Machine (SVM) achieved near-perfect classification.
| Data Type | Accuracy (5-fold CV) | Accuracy (7-fold CV) |
|---|---|---|
| sMRI (Volume) | 95.7% | 95.7% |
| qtdMRI (White Matter) | 91.3% | 91.3% |
| Combined Hemispheres | 97.1% | 98.6% |
Critical Analysis & Conclusion
Takeaway
The study successfully proves that white matter fiber bundle integrity (qtdMRI) and macrostructural volumes (sMRI) are reliable indicators of brain aging phenotypes. Specifically, the symmetry found in the hemisphere analysis suggest that healthy brain aging is a global, bilateral process.
Limitations & Future Work
The primary limitation is the sample size (n=71). While the cross-validation and statistical filters (t-tests and pooling) mitigate overfitting, a larger longitudinal dataset is required to confirm if Cluster 2 individuals actually progress to dementia faster than Cluster 1.
In conclusion, this unified learning framework provides a scalable, efficient solution for mining complex biomedical data, offering a roadmap for identifying patients at risk of cognitive decline long before they enter the clinic.