
Unmasking Physician Collusion: A Spectral Approach to Healthcare Fraud
A Novel Approach to Uncover Health Care Frauds through Spectral Analysis
This paper introduces a novel unsupervised learning framework for detecting healthcare fraud, specifically physician collusions. It leverages spectral analysis on a bipartite (two-mode) network of Primary Care Physicians (PCPs) and Specialists, utilizing a custom "Gap-Cut" algorithm to partition communities and identify suspicious referral patterns.
TL;DR
Healthcare fraud is a multi-billion dollar "black hole" in the economy. This research moves beyond simple rule-based flags to a sophisticated Spectral Analysis of physician referral networks. By treating Primary Care Physicians (PCPs) and Specialists as nodes in a Bipartite (Two-Mode) Graph, the authors use the mathematical properties of the Laplacian Matrix to find hidden communities. Their proposed Gap-Cut algorithm identifies suspicious "closed loops" of referrals—prime targets for fraud investigation.
Background: The Hidden Complexity of Referrals
In the US healthcare system, the referral mechanism is a pivot point for both care coordination and potential abuse. While most referrals are legitimate, "kickback" schemes or fabricated records often manifest as abnormal network structures. Traditionally, these costs were ignored due to the high expense of manual investigation and the lack of labeled datasets for training AI.
The authors argue that fraud is not a feature of an individual node, but a feature of the relationship between nodes.
Methodology: The Power of the Laplacian
The core innovation lies in treating the healthcare claims as a network rather than a flat table.
1. Two-Mode Network Construction
The system maps PCPs and Specialists into a bipartite graph. Unlike a standard social network, edges only exist between a PCP and a Specialist, not within the same group. This preserves the structural integrity of the referral process.
2. Spectral Analysis & the Fiedler Vector
The team constructs a Laplacian Matrix () from the network. The "magic" happens with the Fiedler Vector—the eigenvector corresponding to the second smallest eigenvalue. This vector inherently contains the "connectivity signature" of the graph.
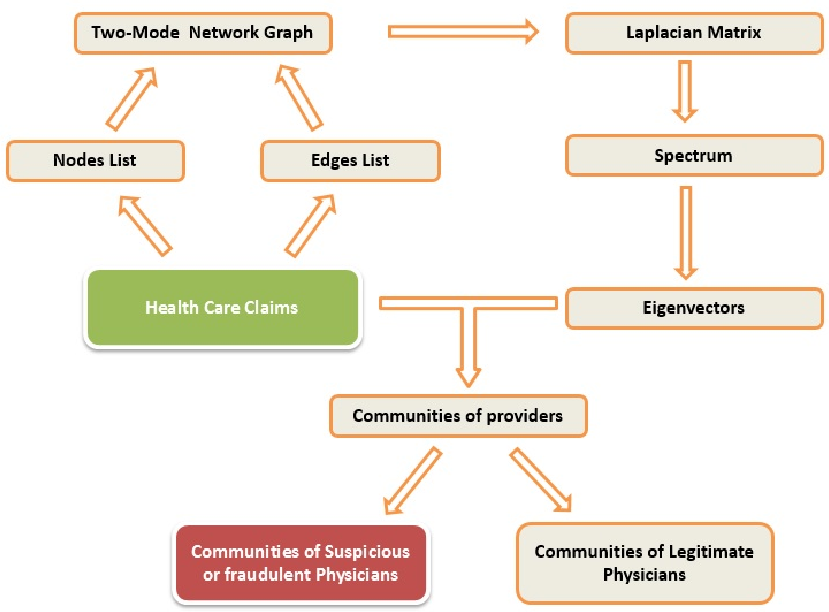 Fig 1: The workflow from raw claim data to eigenvector-based partitioning.
3. The Gap-Cut Algorithm
Standard clustering (like K-means) requires the user to guess the number of clusters (). In investigative work, we don't know how many fraud rings exist. The Gap-Cut algorithm sorts the Fiedler Vector and looks for significant "cliffs" or gaps (). Every time the gap between sorted values exceeds a threshold, a new community is defined.
Experiments and Results
Testing on a real-world dataset (1,101 PCPs, 7,823 Specialists), the algorithm identified 23 distinct communities.
The "Smoking Gun" Patterns
The researchers found that the majority of practitioners belong to three massive, legitimate communities. However, by focusing on small, peripheral communities, they uncovered high-risk patterns:
- Exclusive Hubs: Some specialists had over 20 PCPs who referred patients only to them.
- Isolated Loops: PCPs that ignored the wider network to funnel patients into specific "points" (e.g., PROV0367).
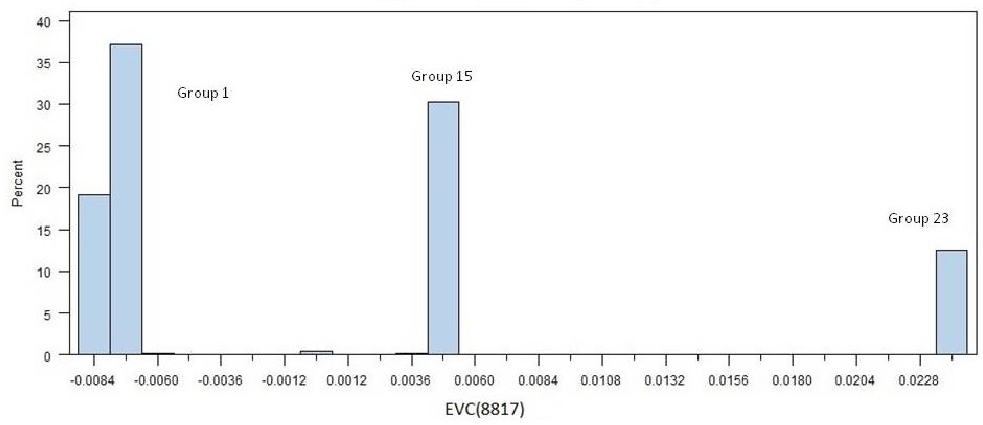 Fig 2: Visualization of the small, high-risk communities. Bolder lines represent higher referral volume.
The algorithm achieved a Modularity of 0.5863, outperforming the InfoMap algorithm and providing a clearer path for investigators to follow.
Critical Insight: Why This Matters
The most profound takeaway from this work is the shift from "Global" to "Local" analysis. In fraud detection, looking at the average behavior is useless. The Gap-Cut approach allows investigators to filter out the "noise" of compliant providers and zoom in on small clusters that exhibit high Inductive Bias toward collusion.
Limitations & Future Work
While highly effective for bipartite structures, the real world is a Multi-Mode network involving patients, pharmacies, and insurance carriers. The authors acknowledge that while their method narrows the search space significantly, it is a tool for lead generation, not a final verdict. Future research will likely explore Hypergraphs or Temporal Spectral Analysis to see how these fraud rings evolve over time.
Conclusion
By combining graph theory with spectral linear algebra, this paper provides a scalable, unsupervised method to fight healthcare fraud. It proves that the "mathematical shape" of our healthcare data can reveal secrets that manual audits might never find.