
Socii: Bridging the Gap Between Graph Theory and Social Reality
Online Social Networks Analysis Visualization Using Socii
This paper introduces Socii, a web-based system designed for the analysis and visualization of Online Social Networks (OSNs) like Facebook and LinkedIn. It provides a user-friendly interface that integrates real-world OSN data with complex network metrics to bridge the gap between academic Graph Theory and end-user comprehension.
TL;DR
Socii is a web-based, user-centric Social Network Analysis (SNA) tool designed to make the invisible visible. Unlike professional tools that require a PhD in mathematics, Socii integrates directly with platforms like Facebook and LinkedIn to provide intuitive visualizations, sentiment mapping, and professional community detection—all through a standard web browser.
Context: Why Traditional SNA Tools Fail the Common User
The landscape of Social Network Analysis has long been dominated by "power tools" like Gephi, UCINET, and Structure. While these are powerhouse engines for data scientists, they suffer from three critical flaws:
- Accessibility Barrier: They are desktop-heavy applications requiring complex installations.
- Fragmented Workflow: Users must manually extract, clean, and import data before seeing a single node.
- Lack of Context: Most tools treat graphs as abstract mathematical entities, losing the "human" element—like what a person’s professional skills are or how they feel.
Socii was developed to pivot the focus back to the user, emphasizing Simplicity, Accessibility, and Contextual Analysis.
Methodology: The Socii Architecture
The authors designed Socii using a modular approach to handle the unstructured nature of social media data.
The Pipeline: From Crawler to UI
- Extraction & Mining: Since many OSN APIs are restricted, Socii uses Selenium and PhantomJS (Python-based crawlers) to extract data. This is then normalized and stored in MongoDB.
- Network Metrics Microservice: A dedicated Flask API uses the NetworkX library to compute degree centrality, clustering coefficients, and community structures on demand.
- Frontend Visualization: The system introduces
react-d3-graph, an open-source React component that leverages D3.js for physics-based node positioning.
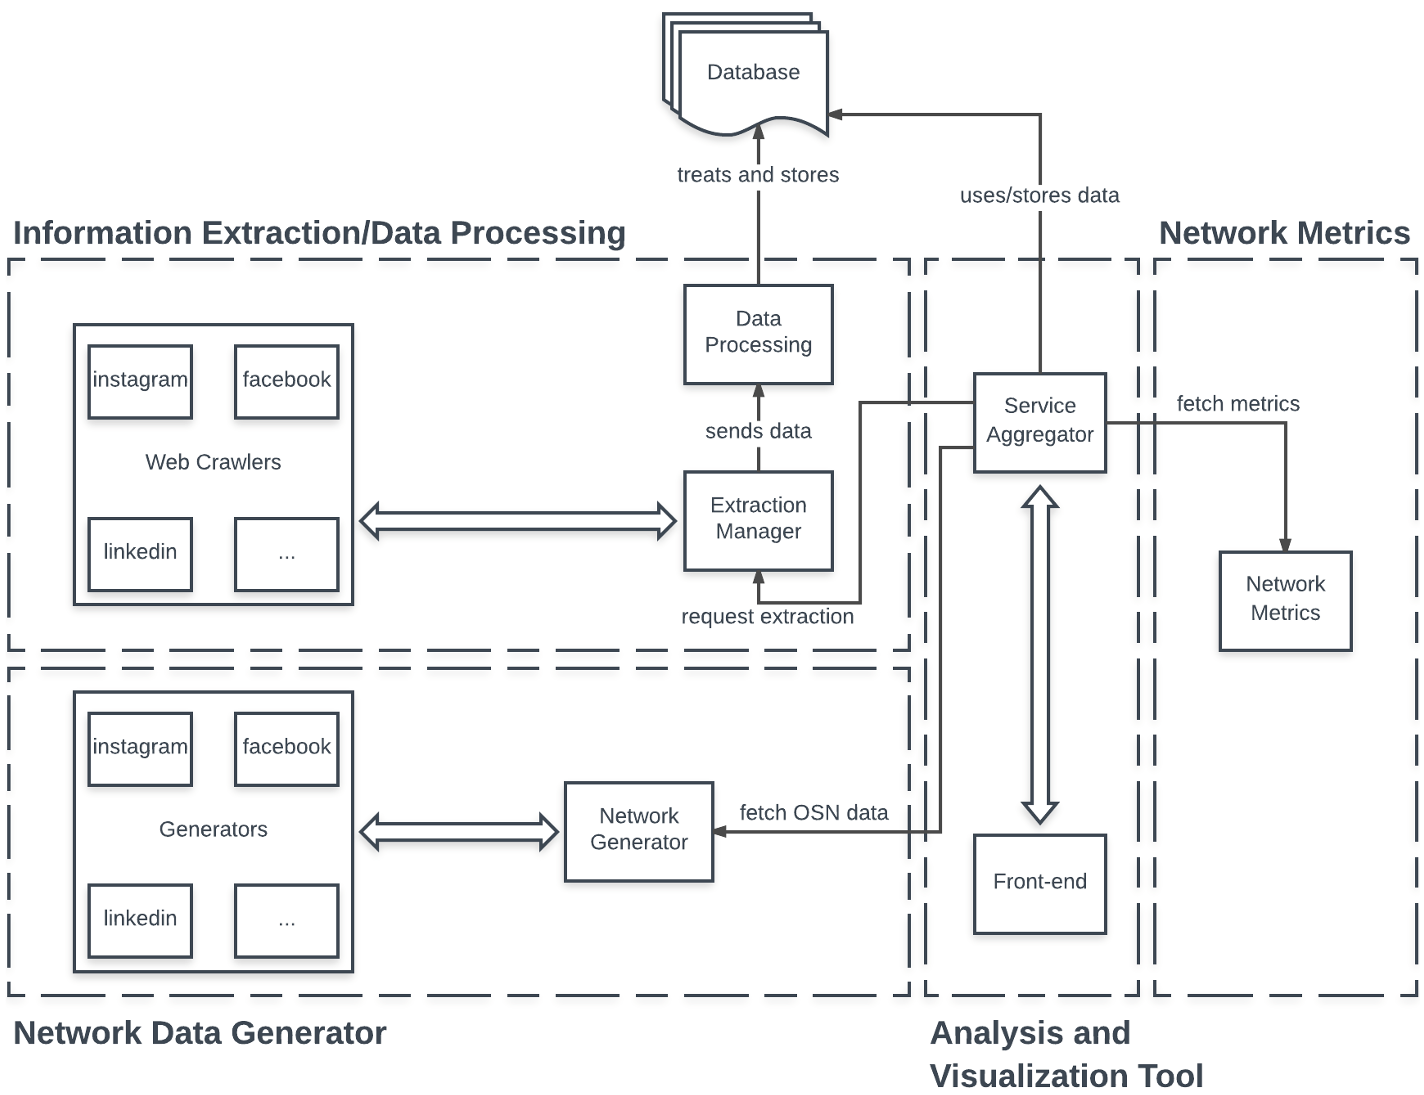 Figure 1: The multi-layered architecture of Socii, separating data extraction from processing and visualization.
Visualizing "Meaning" Over "Metrics"
The core innovation of Socii is its Contextual Analysis. Instead of just showing nodes, the tool allows users to "paint" the network based on social properties:
- Facebook Integration: Implements sentiment analysis where reactions (likes/loves) dictate the color schema of nodes.
- LinkedIn Integration: Features "Human Resource Discovery" where users can color nodes by professional skillsets, making it easier to identify experts within 1st or 2nd-degree connections.
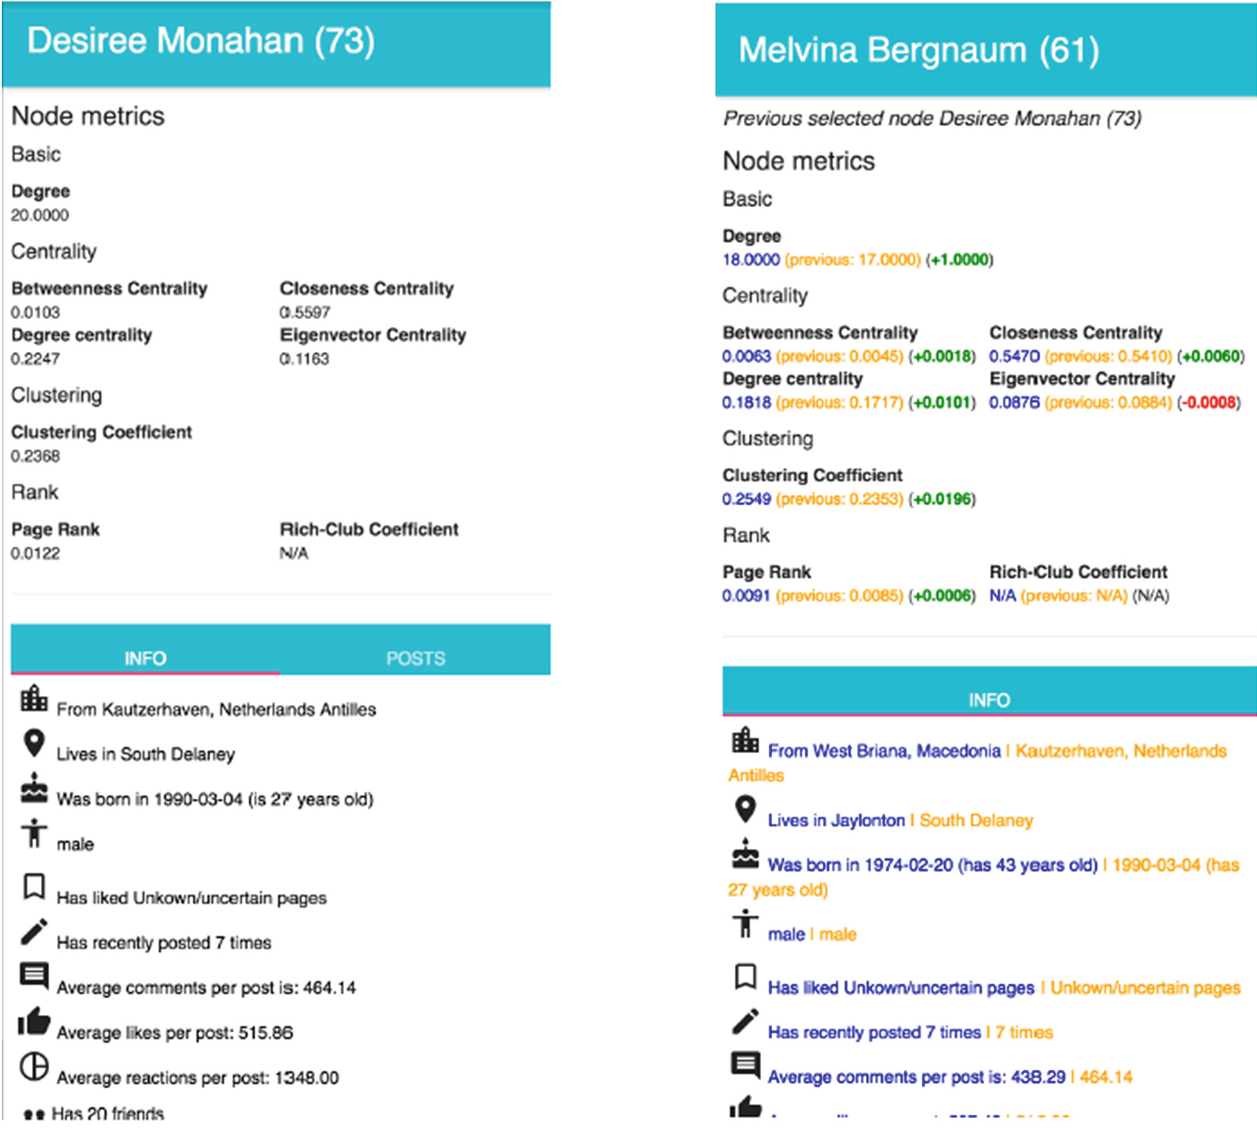 Figure 2: Visualizing professional skill communities (left) and detailed node metrics/OSN data (right).
Performance vs. Accessibility: The Trade-off
The paper honestly addresses the "performance culprit." By choosing a web-based architecture and a crawler-based extraction pipeline, Socii is slower than a desktop C++ application processing a static CSV file. However, for the target audience (general users and sociologists), the utility of real-time OSN integration outweighs the raw processing speed.
Critical Insight & Conclusion
Socii’s greatest contribution isn't a new mathematical algorithm, but the democratization of SNA. By wrapping complex graph theory (Clustering Coefficients, Betweenness) into a UI that looks and feels like a modern web app, it enables non-technical users to perform "Exploratory Data Analysis" on their own lives.
Future Outlook: The authors identify the extraction bottleneck—web crawling is inherently brittle. Future iterations focusing on official APIs (where available) or decentralized data (Web3) could significantly improve the scalability of this "context-first" approach to social networks.
Key Takeaways
- Context is King: A graph is more than dots and lines; it's a map of human sentiment and professional value.
- Web-First Design: Native OSN integration via a browser is essential for real-world adoption.
- Hybrid Analysis: Combining quantitative metrics (Centrality) with qualitative data (User profile) yields the most actionable insights.