
Deciphering the Digital Echo Chamber: How PHT Maps Political Polarization on Twitter
Political Hashtag Trends
The paper introduces Political Hashtag Trends (PHT), a visual analysis system designed to quantify and visualize the political polarization (Left-vs-Right) of Twitter hashtags. By leveraging official political accounts as seeds and analyzing retweet behavior, it identifies trending political issues and their ideological alignment in real-time.
TL;DR
Political Hashtag Trends (PHT) is an analytical framework and tool that measures the ideological "leaning" of trending Twitter hashtags. By tracking how users associated with Democrats or Republicans interact with specific tags, the system provides a real-time barometer of the U.S. political climate, exposing "hashtag wars" and the evolution of political rhetoric.
The Challenge: When a Hashtag Becomes a Battlefield
In the landscape of modern political campaigning, hashtags are more than just metadata; they are linguistic flags used to frame debates. However, identifying which hashtags are actually "political" and which side they belong to is non-trivial. A tag like #russia might be neutral during a sports event but highly polarized during an election. Previous methods often relied on manual labeling or sentiment analysis, which struggles with the irony and "hijacking" prevalent in political discourse.
Methodology: From Seed Users to Ideological Vectors
The researchers at QCRI and L3S developed a robust pipeline to automate the detection of polarization without requiring manual content analysis of every tweet.
1. Identifying the "Politicized" User
The process begins with 33 Seed Accounts—verified, personal accounts of major U.S. politicians (e.g., Barack Obama for the Left, Mitt Romney for the Right).
- The Heuristic: If a user retweets a seed account, they inherit a fractional leaning.
- Geographic Filtering: To ensure the data reflects U.S. politics, the authors used Yahoo! Placemaker to restrict the analysis to users with U.S.-based locations.
2. The Leaning Formula
The core of the system is the leaning score (), ranging from 0 (Right) to 1 (Left). This isn't just a simple count; it uses a voting approach where user volumes are normalized against the total volume of all political hashtags to account for different levels of activity between the two camps.
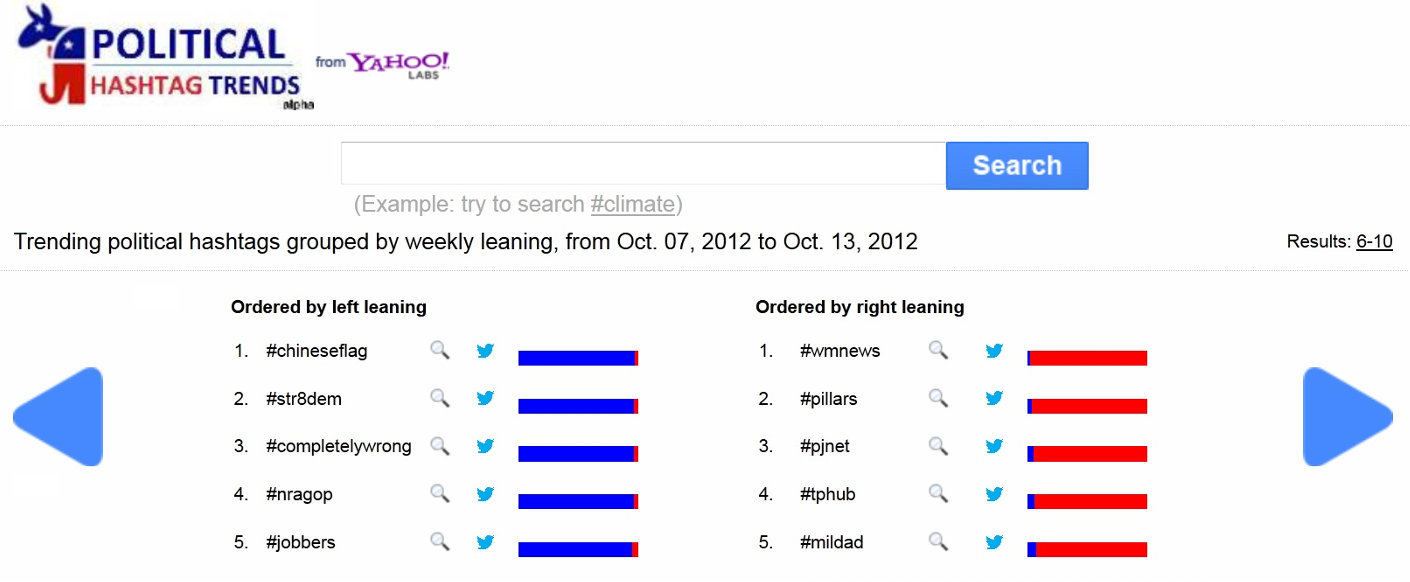 Figure 1: The PHT interface showing trending hashtags categorized by political leaning.
3. Filtering the Noise
To filter out non-political hashtags (like #bday or #coffee), the system calculates a political-to-all user fraction. A hashtag is only considered "political" if it frequently co-occurs with known political keywords (e.g., #gop, #ows, #tcot).
Key Insights and "Hashtag Wars"
The tool's "Historic Information" feature revealed fascinating dynamics in how political language evolves:
- Hashtag Hijacking: Some hashtags, like #middleclass, show sudden jumps in leaning. This indicates a "hashtag war" where one party attempts to take over a narrative previously dominated by the opposition.
- Burst Intensity: The system doesn't just look at what is popular, but what is surging. By calculating a "Burst Index," PHT identifies emerging issues before they become mainstream news.
 Figure 2: The formula used to calculate the 'Burst Intensity' (), prioritizing relative frequency increases over absolute volume.
Critical Analysis: The Power of User-Centric Metrics
A significant contribution of this work is the choice to use User Counts rather than Tweet Counts. In the era of bots and "super-posters," a single aggressive user can skew tweet-based metrics. By counting each user only once per week per hashtag, PHT achieves a much higher resistance to outliers and manipulation—an essential feature for any tool measuring public opinion.
Conclusion
PHT serves as a powerful lens through which we can observe the fragmentation of the digital public square. While the methodology is rooted in the 2012 election cycle, its fundamental logic—propagating ideological labels from influential nodes to the periphery—remains a cornerstone of social media forensics today. As "hashtag wars" continue to define global politics, tools that can objectively measure this polarization are more critical than ever.