
PortInterlock: Decoding Corporate Social Capital for Superior Portfolio Performance
Portfolio Optimization and Corporate Networks: Extending the Black Litterman Model
The paper introduces PortInterlock, a novel portfolio optimization framework that bridges the Black-Litterman (BL) model with social network analysis and machine learning. By extracting "investor views" from link mining within corporate director and analyst networks, it achieves a significant Sharpe ratio of 6.56, vastly outperforming the market CAPM baseline.
TL;DR
Standard portfolio optimization is often a "garbage in, garbage out" process due to its reliance on volatile historical returns. This paper introduces PortInterlock, an algorithm that mines the social networks of corporate boards and financial analysts to generate objective "views" for the Black-Litterman model. By quantifying the "power" and "influence" of companies through network centrality, the author achieves a risk-adjusted return (Sharpe Ratio) nearly 5x higher than the market average.
Background: Beyond the Markowitz Curse
The Markowitz "Mean-Variance" framework is the bedrock of modern finance, yet it is practically fragile. Small changes in expected returns lead to massive swings in asset weights. The Black-Litterman (BL) model solved this by starting with a "Market Equilibrium" (CAPM) and allowing investors to overlay their "Views."
However, where do these views come from? Usually, they are subjective guesses. PortInterlock solves this by using Link Mining—treating the corporate world as a web of shared directors and analysts.
Methodology: The Fusion of Graphs and Finance
The author's approach, PortInterlock, operates in four distinct phases:
1. The Social Network Layer
The algorithm builds a bipartite graph where one set of nodes is companies and the other is directors/analysts. By projecting this into a "company-to-company" network, the author calculates:
- Betweenness Centrality: Companies that act as "information bridges."
- Closeness Centrality: How fast information reaches a firm.
- Clustering Coefficient: The "cliquishness" of a corporate neighborhood.
2. The Machine Learning Layer (LogitBoost)
Instead of simple regression, the author employs LogitBoost. This ensemble method selects the most relevant features from a mix of social indicators and accounting variables (like Sales Growth or Accruals) to predict Earnings Surprise (FE).
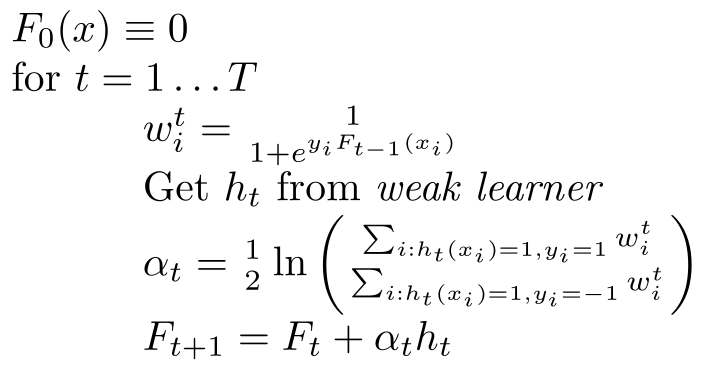 Figure 1: The mathematical formulation of the LogitBoost process used to refine investment signals.
3. Integration with Black-Litterman
The predictions from LogitBoost are transformed into the vector (expected returns of the views) and the matrix (the assets the views apply to). These are then blended with the market equilibrium to produce the final posterior weights .
Experimental Evidence: Slaying the Market
The study analyzed over 3,000 US companies over a decade. The results were stark:
- Sharpe Ratio: The PortInterlock BL model reached 6.563.
- Market Comparison: During the same period, a standard Market Portfolio managed a Sharpe of only 1.415.
- Accuracy: Predicting the direction of earnings surprise proved much more reliable (19% error) than predicting abnormal returns directly (47% error).
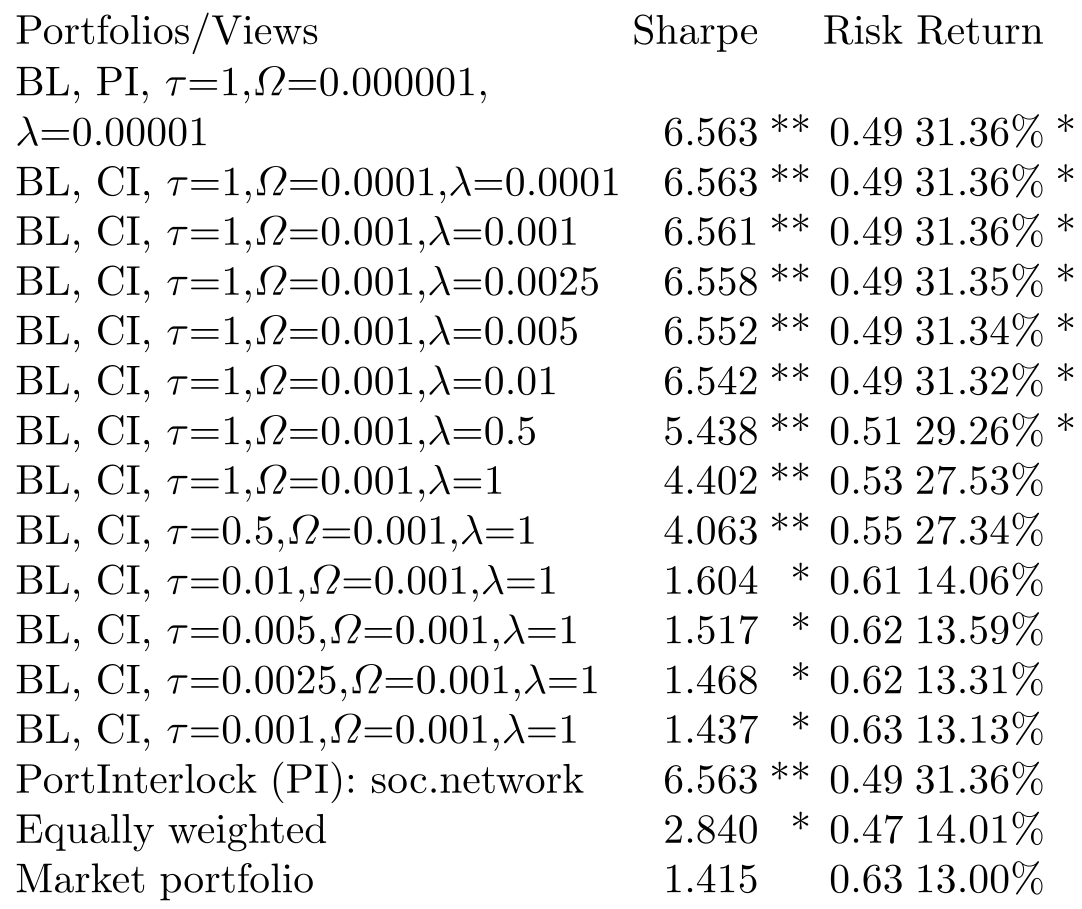 Table 1: Strategic comparison showing PortInterlock's dominance in risk-adjusted returns across different confidence levels ().
Critical Insight: Why Does Social Centrality Matter?
The core "Why" behind this paper is Information Flow. Directors sit on multiple boards; analysts cover multiple similar firms. Information (and perhaps "corporate DNA") leaks through these connections. A company that is "central" in the network has its earnings forecasted more accurately (or influenced more predictably) by the market, and PortInterlock captures this "Network Alpha" before it is fully priced in.
Summary & Future Outlook
This paper serves as a bridge between SNA (Social Network Analysis) and Bayesian Portfolio Management. While the data used is annual/quarterly, the logic is timeless: the structure of the network dictates the flow of value.
Limitations: The model relies on the availability of director/analyst relationship data, which may be harder to source in emerging markets. Future Work: Integrating real-time social media "sentiment" networks with these formal "corporate" networks could yield an even more potent predictive engine.