
Beyond Income: Decoding Poverty Levels via Multidimensional Feature Mining
Poverty Level Characterization via Feature Selection and Machine Learning
2019-04-01
Summary
Problem
Method
Results
Takeaways
Abstract
The paper presents a machine learning framework for multidimensional poverty characterization using household data from Costa Rica. It utilizes a class-specific feature selection strategy combined with Random Forest ensembles and LIME explanations to achieve more granular socio-economic classification than traditional binary models.
## TL;DR
Poverty is more than just a low paycheck; it is a complex tapestry of living conditions, education, and social capital. This paper introduces a framework that doesn't just predict *if* a household is poor, but identifies exactly *why* they fall into specific categories (Extreme, Moderate, or Vulnerable) using class-specific feature selection and the LIME interpretability tool.
## The Motivation: Why Binary "Poor vs. Non-Poor" Fails
Traditional poverty assessments often rely on the **Proxy Means Test (PMT)** or simple income thresholds. However, these methods are frequently "black boxes" or too simplistic. In reality, a household might be "vulnerable" due to high dependency rates, while another is in "extreme poverty" due to a total lack of physical assets.
The authors argue that current Machine Learning (ML) models solve for accuracy but fail at **characterization**. To build effective policy, we need to know which unique levers (features) define each specific socio-economic tier.
## Methodology: Hunting for Class-Specific Signals
The researchers developed a pipeline designed to handle the messy, imbalanced reality of household survey data.
### 1. The 4-Stage Extraction Pipeline
The core innovation is the decomposition of a multi-class problem into class-specific insights:
* **Binarization**: Instead of attacking all four classes at once, the model looks at "Extreme Poverty vs. Everyone Else."
* **SMOTE (Synthetic Minority Over-sampling Technique)**: To prevent the model from ignoring the small percentage of extremely poor households, synthetic data points are created to balance the classes.
* **Step Forward Feature Selection (SFFS)**: A greedy search to find the top 6 features that best define a single class.
* **LIME (Local Interpretable Model-agnostic Explanations)**: This provides the "Human-Readable" reason for a prediction, such as "House lacks a toilet" or "Education level is postgraduate."

*Fig 1: The proposed framework for class-specific feature subset selection.*
## Experimental Analysis: What Defines Deprivation?
The study used data from the Inter-American Development Bank of Costa Rica. An interesting visualization using **t-SNE** (Fig 3) shows that poverty classes are highly overlapping ("mixed"), documenting how difficult it is to draw a clean line between "Moderate" and "Vulnerable" households.
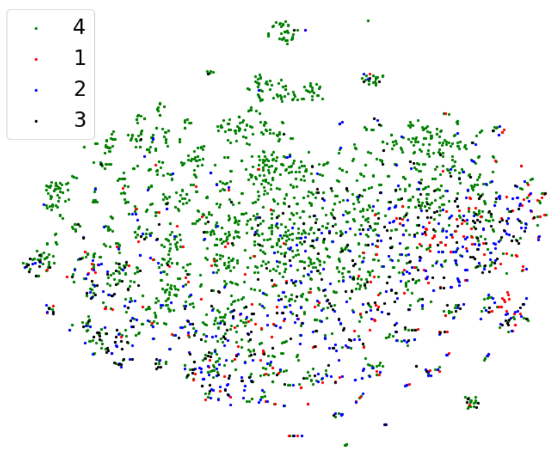
*Fig 3: Visualization showing the heavy overlap between poverty levels.*
### Key Findings from Feature Mining:
* **Extreme Poverty**: Primarily characterized by **Physical Capital** and **Standard of Living** (e.g., number of tables, quality of walls, absence of postgraduate education).
* **Vulnerable Class**: Characterized by **Education** (e.g., average years of education for adults) and household composition (number of children).
* **Non-Vulnerable**: Defined by **Social Capital** and modern amenities (telephone per person, television, and good roofs).
## Performance and Real-World Impact
The Random Forest classifier achieved a **Test F1-macro score of 0.425**. While this may seem numerically low compared to standard ML benchmarks (like ImageNet), it represents a significant challenge in socio-economic data where "noise" and "subjective bias" are high.
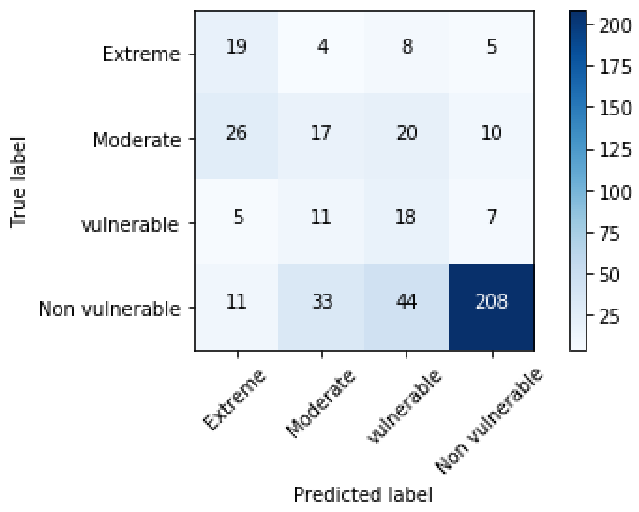
*Fig 4: Confusion Matrix showing the model's performance and the significant mixing between Moderate and Vulnerable classes.*
## Critical Insights & Conclusion
The value of this paper is not just in the prediction—it's in the **explanation**. By showing that "Extreme Poverty" reacts to different features than "Vulnerability," the authors provide a roadmap for policy interventions.
**Takeaway for Data Scientists**: When dealing with socio-economic data, global feature importance is a lie. Indicators that matter for the bottom 10% are often irrelevant for the middle class. Class-specific selection is the way forward for fairness and actionable insights.
**Limitations**: The high degree of overlap in the confusion matrix suggests that even more dimensions (perhaps psychological or geographical data) might be needed to fully disentangle the "Vulnerable" from the "Moderate" poor.