
Pre-Crowdsourcing: Can Your Smartphone Replace a $50k Channel Scanner?
Pre-Crowdsourcing: Predicting Wireless Propagation with Phone-Based Channel ality Measurements
The paper introduces a "Pre-Crowdsourcing" framework to evaluate whether smartphone-based signal measurements (LTE/GSM) can replace expensive professional drive-testing equipment for wireless propagation modeling. Using a custom app "WiEye" and professional tools, the authors demonstrate that crowdsourced data effectively characterizes large-scale fading (path loss) despite hardware limitations.
TL;DR
Evaluating cellular coverage usually involves engineers driving around with backpacks full of expensive equipment. This paper explores "Pre-Crowdsourcing"—using standard smartphones to predict wireless propagation. By analyzing data from 60,000 users and conducting controlled field tests, the researchers prove that despite hardware limitations, smartphones can estimate path loss exponents with over 97% accuracy compared to professional-grade scanners.
Background: The Cost of Visibility
Carrier network optimization is a resource black hole. To understand signal propagation, engineers use drive testing: outfitting vehicles with high-powered channel scanners and specialized software. While accurate, this is slow and fails to account for indoor performance or rapid environmental changes (like new construction). Crowdsourcing is the logical successor, but a critical question remains: Can we trust the "noisy" data from a consumer-grade smartphone?
The "Mobile Phone Shortcomings" Problem
The authors identify four critical hardware limitations that differ from professional scanners:
- Averaging: Phones average samples to suppress fluctuations, which can "flatten" the perceived channel.
- Quantization: Android reports signal strength in discrete steps (ASU), losing the granularity of raw RF.
- Sampling Rate: Scanners sample at 500Hz; phones typically report at 1Hz (API level) or 3Hz (Firmware level).
- Clipping: Phones have less sensitive receivers, meaning they "fail" to see weak signals that a scanner would still catch.
Methodology: The Comparative Rig
The researchers built a side-by-side testing rig on a car roof, containing:
- Rohde & Schwarz TSMW Channel Scanner (The Ground Truth).
- Multiple smartphones (Samsung GS5/S8, Nexus 5X, Google Pixel).
- WiEye App: A custom tool to capture API-level data.
- Qualipoc: A professional tool to capture firmware-level data directly from the phone chipset.
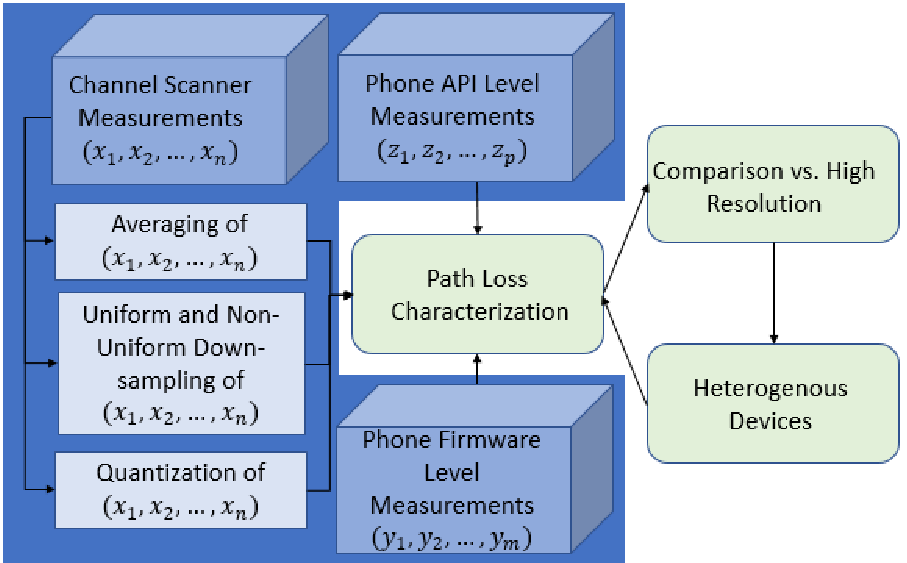 The workflow: comparing professional channel scanner data with phone API/Firmware measurements after accounting for pre-processing effects.
Key Insights: What Actually Matters?
By isolating each imperfection, the study yielded surprising results:
1. The Power Bias
There is a systematic "bias" where smartphones report lower power than scanners. On average, scanners recorded signals 3.0 to 4.4 dBm higher than phones. However, because this bias is relatively constant, it can be calibrated out.
2. Spatial Distribution > Sample Count
The most significant finding was that how you sample is more important than how much you sample.
- Uniform Downsampling (taking fewer samples at regular intervals) had very little impact on the Path Loss Exponent ().
- Non-Uniform Spatial Clustering (having many users in one spot and none in another) caused the highest errors.
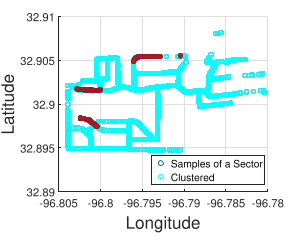 Comparison of RMSE: Spatially clustered data (typical of real-world crowdsourcing) significantly increases error compared to uniform distribution.
3. Quantization is a Non-Issue
Many researchers feared that the 1dB resolution of Android signal reporting would ruin propagation models. This study proved that quantization impact is negligible (less than 1% of the total error).
Results: Global Validation
The authors applied their findings to crowdsourced data from Dresden (Germany) to Macon (Georgia). The inferred path loss exponents matched the physical reality:
- Dresden (): Tall buildings and dense trees (High attenuation).
- Thiersheim (): Open free space (Low attenuation).
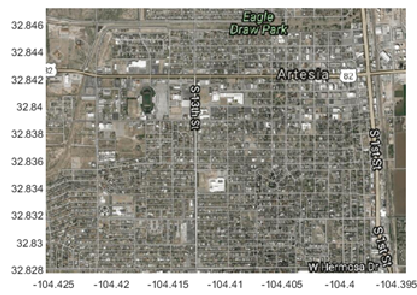 Crowdsourced signal heatmaps from different global environments, successfully used to derive local propagation characteristics.
Critical Analysis & Conclusion
This work provides the empirical "green light" for carriers to lean heavily on Minimization of Drive Test (MDT) specifications.
Takeaways for Industry:
- Calibration is King: Don't trust raw dBm values; always calibrate for the specific phone model's bias.
- Encourage Movement: Use app incentives to encourage users to provide data in "empty" spatial zones rather than just collecting millions of samples in high-traffic areas.
Limitations: The study focuses on large-scale fading. Small-scale fading (multipath) still requires the high sampling rates (500Hz) of professional scanners, which smartphones currently cannot reach at the API level.
The future of network planning isn't in a specialized van; it's in the pocket of every subscriber.