
Predicting Social Network Measures: A Macro-Trend Approach to Network Evolution
Predicting Social Network Measures Using Machine Learning Approach
This paper investigates predicting global social network measures (e.g., density, link count, average distance) using machine learning instead of traditional individual link prediction. It evaluates two primary techniques—Time Series Forecasting and Classification—across two real-world email datasets, demonstrating that predicting structural trends is a more computationally efficient alternative to reconstructing the full network topology.
TL;DR
In social network analysis, we often obsess over who will connect with whom. This paper argues that such a granular view is a computational bottleneck. Instead, the authors demonstrate that we can skip individual link prediction entirely and use Machine Learning to directly forecast global network health—like density and average distance—treating the network's evolution as a time-series or classification problem.
Background Positioning
Most link prediction research follows the path laid by Liben-Nowell and Kleinberg (2003), focusing on the adjacency matrix. This work shifts the coordinate system from the "Micro-level" (edges) to the "Macro-level" (global measures). It positions itself as a resource-saving alternative for network managers who need to know if their community is expanding or fragmented without needing the exact graph topology.
Problem & Motivation: The Cost of Precision
Existing methods are often "overkill." If a manager wants to know if a company's internal communication is becoming more siloed (measured by Average Distance), do they really need to predict 100,000 potential new e-mail links first?
- Computational Complexity: Reconstructing an entire future adjacency matrix is NP-hard in many variations.
- Noise: Individual link formation is highly stochastic, whereas global measures tend to follow more stable, aggregate patterns.
The authors' insight is simple: treat the sequence of network measures as a signal. By doing so, we reduce a high-dimensional graph problem into a low-dimensional forecasting problem.
Methodology: Forecasting vs. Classification
The study defines a Temporal Social Network (TSN) as a sequence of graph snapshots .
1. Time-Series Forecasting
The authors calculated 9 core measures (Density, Link Count, Betweenness, etc.) across various time windows (3 to 15 days). They then applied "Base Learners" to predict the value at .
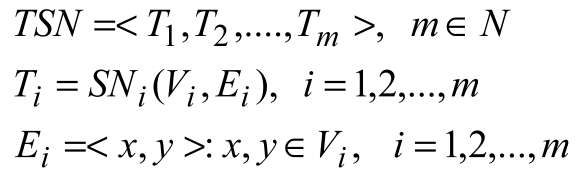 (Equation 1: The Formal Definition of Temporal Social Networks)
2. The Classification Shortcut
Recognizing that exact numbers are hard to hit, they mapped measure changes into classes:
- GC1 (Granular): 11 classes representing fine-grained changes.
- GC2 (Coarse): 3 classes representing "Small," "Medium," and "Large" changes.
Experiments & Results
The researchers used two primary datasets: University email logs and a private manufacturing company’s records.
SOTA Comparison & Observation
- Forecasting: Surprisingly, there was no single "winner" among algorithms (Linear Regression vs. SVM vs. MLP). The results were stable across learners, implying that the quality of the data/time-window matters more than the model complexity.
- Accuracy Trade-off: As shown in the classification results, there is a massive drop-off when moving from 3 classes to 11 classes.
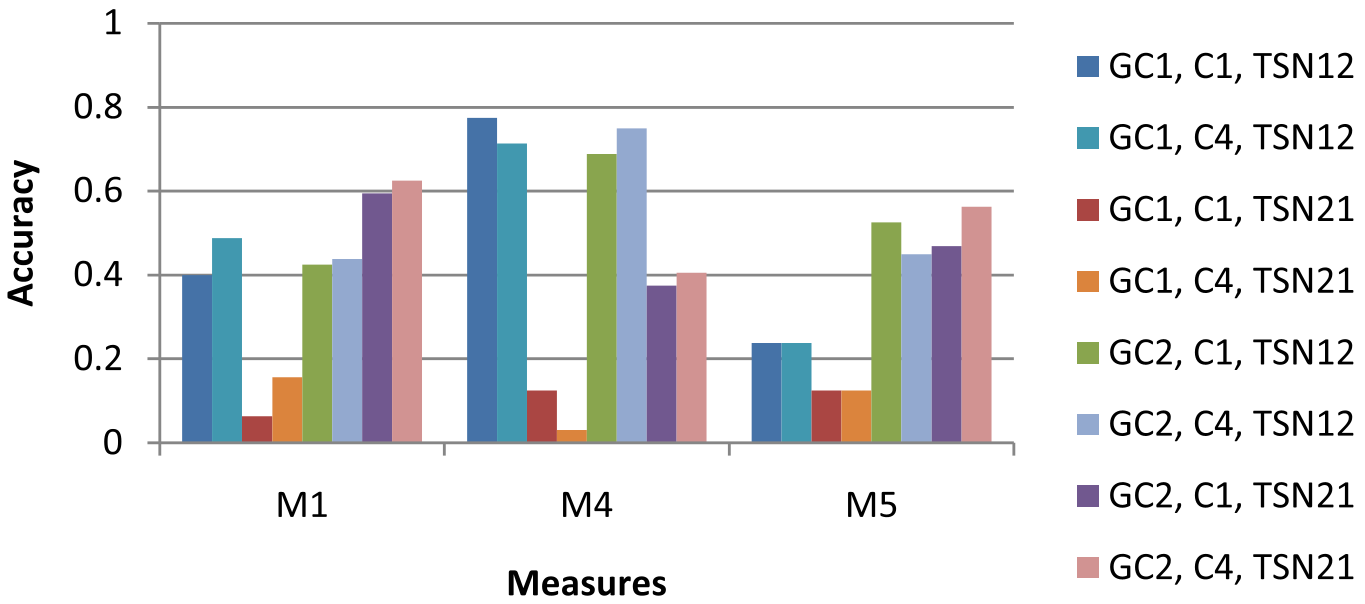 Figure 2: Accuracy significantly peaks when task complexity is reduced (3-class system vs 11-class).
Key Findings:
- Window Size Matters: Longer time-series history generally led to better forecasting.
- Predictable Measures: "Average Distance" and "Link Count" proved to be the most "forecastable" metrics, likely due to their gradual evolution compared to more volatile metrics like "Transitivity."
Critical Analysis & Conclusion
Takeaway
For practical industrial applications, precise link prediction is often an unnecessary expense. This paper validates that we can achieve ~60% accuracy in predicting major structural shifts using standard, off-the-shelf classifiers.
Limitations
- The "Accuracy Gap": While 60% is better than random, it remains insufficient for high-stakes decision-making.
- Feature Interaction: The study found that using a single measure to predict itself was ineffective, but a matrix of all measures (L2) worked better. This suggests heavy cross-correlation between graph metrics that simple time-series models might struggle to decouple.
Future Outlook
The authors suggest looking into Graph Edit Distance (GED). By correlating global measures with the number of edits (adds/deletes) required to transform one snapshot to another, we might find a "Physics of Social Networks" that explains why certain measures move in tandem. For practitioners, this opens the door to "Health Dashboards" for networks that predict collapse before it happens.