
Beyond the Census: Decoding Your Social Status Through App Habits
Predicting Socio-Economic Levels of Individuals via App Usage Records
This paper introduces an individual socio-economic level (SEL) prediction model based on App usage and mobility records. By utilizing Factorization Machines (FM) on a dataset from China Telecom and Sina Weibo in Shanghai, the authors achieve over 80% classification accuracy across four SEL categories.
TL;DR
Researchers from Sun Yat-sen University and Tsinghua University have developed a machine learning framework that predicts an individual's socio-economic level (SEL) with 84.3% accuracy. By analyzing "low-cost" data—App usage durations and GPS-linked mobility records—the model bypasses the need for expensive and slow traditional census surveys, providing a real-time window into consumer purchasing power and social stratification.
The Dying Pulse of Traditional Surveys
How do we measure the wealth and status of a city's residents? For decades, the answer has been the National Statistical Institute (NSI) census. However, the NSI approach is fundamentally "offline"—it costs millions, requires massive manpower, and in China, only refreshes every five years.
While previous tech-driven attempts used call logs (CDR) or Twitter posts, they are losing relevance. People use WeChat/WhatsApp more than voice calls now, and many social media users are "silent browsers" who leave no text for sentiment analysis. This creates a data gap that this paper seeks to fill using the most ubiquitous sensor in our pockets: the smartphone's application usage log.
Methodology: The Digital Mirror of Status
The researchers mapped 660 individuals in Shanghai by cross-referencing China Telecom usage records with Sina Weibo occupation data (used as the ground truth labels).
1. Feature Engineering
The model looks at two primary dimensions:
- App Behavioral Features: Time spent on 16 categories (Finance, Travel, Game, Health, etc.) across different time windows. They noticed that when and what you browse (e.g., Stock apps on a Monday morning vs. Games on a Sunday night) are strong social signifiers.
- Mobility Features: The researchers divided Shanghai into 188 blocks categorized by economic level. They tracked how frequently users visited "rich" vs. "intermediate" vs. "poor" blocks.
2. The Factorization Machine (FM) Architecture
Unlike standard linear models, the authors employed a Factorization Machine (FM). The genius of FM lies in its ability to model the interactions between features. For instance, "using a Travel app" might mean nothing alone, but "using a Travel app while frequently visiting high-end business districts" is a powerful indicator of a high SEL.

Overcoming the "Average" Bias
A major challenge in this study was class imbalance. In the real world (and their dataset), the "Middle" class dwarfs the "Elite" or "Lower" classes. Initial models simply predicted everyone was "Middle Class" to achieve high raw accuracy.
To solve this, the authors used SMOTE (Synthetic Minority Over-sampling Technique). By bloating the minority class samples through synthesis, the model finally "learned" the unique habits of scientists and bank presidents (Upper SEL) versus insurance salesmen (Middle-lower SEL).
Results: FM Outperforms the Classics
The results were conclusive. The FM-based model outperformed both Random Forests and SVMs across every metric—Precision, Recall, and F1-score.
| Model | Precision | Recall | F1-Score | Accuracy |
|---|---|---|---|---|
| Random Forest | 0.59 | 0.68 | 0.63 | 0.680 |
| SVM | 0.58 | 0.76 | 0.65 | 0.756 |
| FM-based Model | 0.84 | 0.84 | 0.84 | 0.843 |
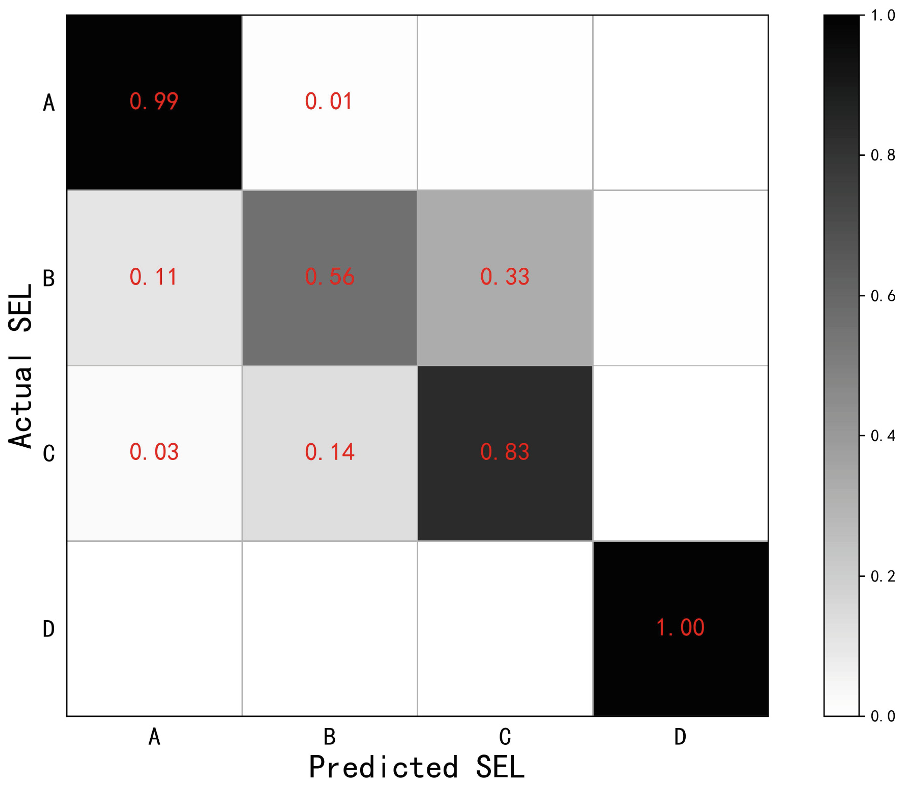 Figure: The confusion matrix shows a dramatic improvement in identifying minority SEL groups after applying SMOTE.
Deep Insights & Future Outlook
This work demonstrates that our relationship with our phones is a deep reflection of our place in the social hierarchy.
- Takeaway: High-accuracy SEL prediction is possible without invasive manual surveys. This has enormous implications for precision marketing (targeting high-value users) and urban planning (identifying underserved areas in real-time).
- Limitations: The model currently struggles with the "Lower SEL" (e.g., rickshaw pullers) because these individuals often lack an active social media presence/Sina Weibo identification, leading to a data blind spot.
As we move toward a world where the smartphone is an extension of the self, papers like this suggest that our digital footprints aren't just data—they are a socio-economic biography.