
Decoding Classroom Chemistry: Predicting Student Seating through Social Affinity
Predicting Student Seating Distribution Based on Social Affinity
The paper proposes an automated system to construct classroom social networks and predict student seating distributions by analyzing classroom photos. It utilizes the center projection principle for localization and a modified Social Affinity Map (SAM) to achieve a seating prediction accuracy of 82.1%.
TL;DR
Researchers have developed a fully automated pipeline that turns standard classroom photos into a map of student social lives. By applying geometric projection and social affinity modeling, the system can predict where a student will sit with 82.1% accuracy, proving that classroom seating is far from random—it is a spatial manifestation of human connection.
Motivation: The Hidden "Social Map"
Every professor knows that certain students are inseparable, while others drift to the back of the room. This isn't just a matter of preference; it's a social network. Understanding these connections is vital for identifying at-risk students or designing group activities. However, gathering this data has historically required tedious surveys or invasive tracking. This paper asks: Can we reconstruct these social networks simply by looking at where students choose to sit over a semester?
Methodology: From Pixels to Social Graphs
1. Fully Automated Localization
Unlike prior works that required manual seat marking, this method uses high-school geometry scaled to the computer vision era.
- Face Detection: First, students are identified using the AdaBoost algorithm.
- Center Projection & Linear Fitting: To handle the perspective distortion of a camera at the front of the room, the authors use the Center Projection Principle. They identify the leftmost and rightmost students to find the "vanishing point" of the classroom.
- Angle Measure Evaluation (AMEM): Since students aren't perfectly aligned points, the system calculates the tangent of the angle between students and the projection point to determine who belongs in the same column.
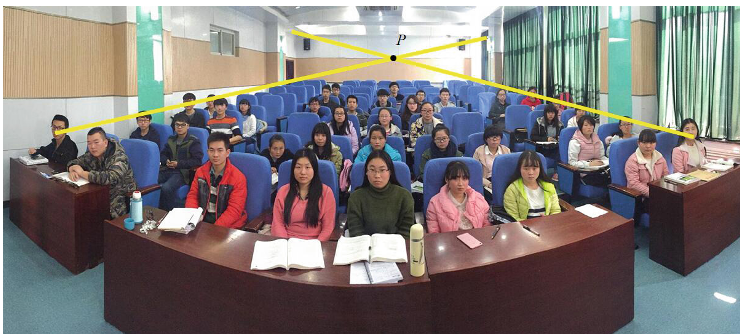 Fig 1: Mathematical determination of the center projection point to align the classroom grid.
2. Modeling Affinity with SAM
The core "social" engine is a modified Social Affinity Map (SAM). For every student, the system builds a matrix of their eight nearest neighbors (Front, Back, Left, Right, and Diagonals). By accumulating this data over 25 class sessions, the system identifies who acts as a "cluster," capturing the physical signature of a friendship.
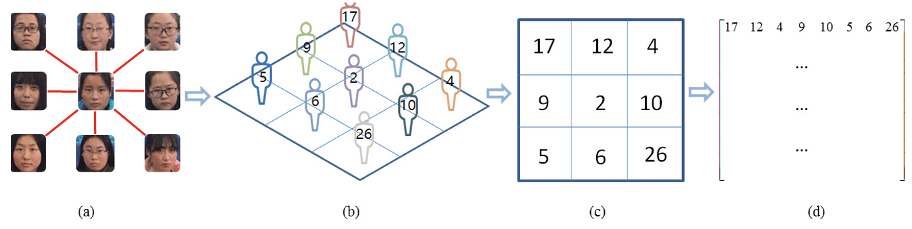 Fig 2: The 8-neighbor SAM descriptor used to quantify social proximity.
3. The Greedy Prediction Algorithm
To predict the seating for the next class, the authors employ a Greedy Algorithm:
- Place the "anchors": The top 1/3 of students who rarely change their seats are placed first.
- Iterative Filling: Based on the SAM history, the system identifies the "best friend" of an already placed student and assigns them to the most likely adjacent empty seat.
Experimental Results
Testing on a dataset of a full semester (26 attendance records), the results were striking:
- Deskmate Matching Accuracy: 84.3%. The system successfully identified who was sitting next to whom in nearly 8.5 out of 10 cases.
- Distribution Prediction: 82.1%. When the classroom was divided into eight functional zones, the model correctly predicted the zone for the vast majority of students.
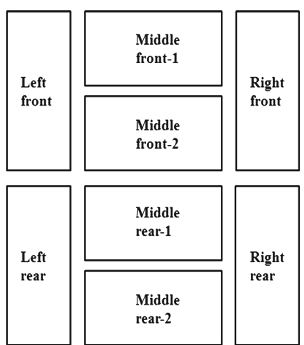 Fig 3: Validation zones used to measure prediction success.
Critical Insight: Beyond Attendance
The value of this work isn't just automated attendance. It provides a non-invasive way to measure social cohesion.
- Insight 1: Stability in seating is a proxy for social stability.
- Insight 2: High-affinity clusters can be leveraged for Peer-to-Peer learning. If a student is absent, the system can immediately suggest which "neighbor" the instructor should contact.
Limitations and Future Work
While the 82.1% accuracy is impressive, the system currently treats rectangular rooms as the default. More complex "stadium-style" or "round-table" classrooms might require more sophisticated 3D manifold modeling. The authors' next step is the most exciting: correlating these social clusters with actual academic grades to see if your friends really do influence your GPA.
Conclusion (Takeaway)
This research demonstrates that Social Affinity Map (SAM) modeling can turn simple classroom photos into a powerful tool for educational psychology. By quantifying "who sits where," educators can gain a much deeper understanding of the social dynamics that drive student engagement and success.