
Predictive Pulse: Mining Multi-layered Twitter Sentiment for Stock Forecasting
Public Sentiment Analysis in Twitter Data for Prediction of a Company's Stock Price Movements
The paper introduces a multi-layered sentiment analysis framework to predict specific company stock price movements using Twitter data. By leveraging NLP and a specialized association rule mining algorithm on 15 million tweets, the authors achieved an average stock movement prediction accuracy of 76.12% for IT-related companies.
TL;DR
Can a tweet about a "shoddy iPhone battery" actually predict Apple's stock price movement? This paper argues yes. By moving beyond general "market mood" and focusing on a multi-layered attribute model, the researchers achieved a 76.12% prediction accuracy in the IT sector, identifying a consistent 3-day lead time between social media sentiment and market shifts.
Problem & Motivation: Moving Beyond "General Mood"
Most existing research, such as the famous Bollen et al. (2010) study, focuses on the Dow Jones Industrial Average (DJIA)—a broad market index. While valuable, these models fail to help investors interested in specific companies.
The authors identify a major structural flaw in current sentiment mining: Attribute Ambiguity. Social media data is messy and hierarchical. A user might tweet about the "retina display" (a feature) of a "MacBook" (a product) manufactured by "Apple" (the target company). Standard mining often misses these linkages, treating "battery" and "Apple" as unrelated entities. This paper seeks to solve this by modeling the "Internal Connections" between lower-layer features and top-level corporate targets.
Methodology: The Core Engine
The proposed methodology is split into a robust NLP pipeline and a sophisticated statistical association framework.
1. Sentiment Classification Pipeline
The authors utilized SentiWordNet 3.0 to calculate numerical scores for positivity, negativity, and neutrality. Using a Vector Space Model (VSM) and TF-IDF to weight terms, they categorized tweets into five labels: Positive+, Positive, Neutral, Negative, and Negative-.
2. Association Rule Mining (The "Why" it Works)
Instead of simple keyword counting, the authors use:
- Chi-square Tests: To determine if a correlation between an attribute (e.g., "iPad color") and a stock move is statistically significant.
- Adjusted Residuals: To identify "interesting" patterns, such as whether a "Negative-" sentiment regarding a product feature specifically implies a "Down-" movement of the stock.
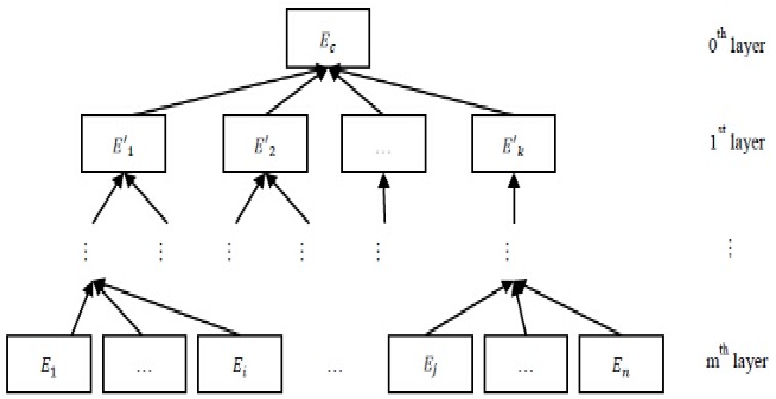 Figure 1: The hierarchical model connecting low-level product features to top-level company entities.
Experiments & Results: The T+3 Discovery
The researchers monitored 30 companies (including Apple, Amazon, and Microsoft) and crawled 15 million tweets.
Key Findings:
- Industrial Variance: The IT industry was the most "predictable" at 76.12% accuracy, followed by Media (73.78%). Manufacturing was the least predictable (52.94%), likely because manufacturing stocks are driven more by supply chains than public hype.
- The 3-Day Lag (T+3): The highest accuracy occurred when using today's tweets to predict the price 3 days later. This is a profound insight, as it mirrors the American stock market's 3-day settlement rule.
- Benchmark Superiority: The proposed algorithm outperformed classic models like SVM (63.34%), C4.5 (60.15%), and Naïve Bayes (59.79%).
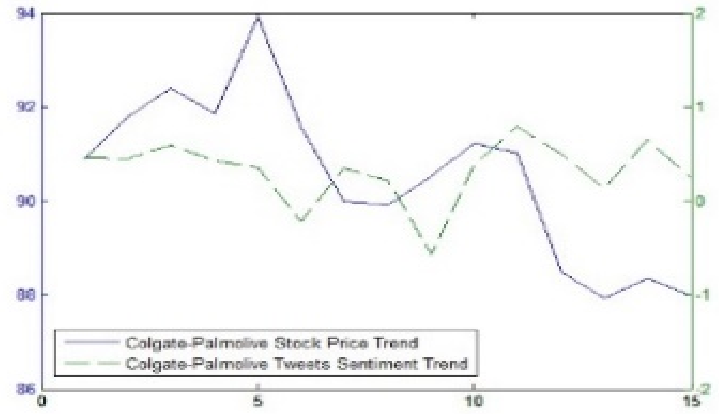 Figure 2: Visualizing the close correlation between sentiment degree (line) and actual stock price (dots).
Critical Analysis & Conclusion
Takeaway
The value of this work lies in its hierarchical taxonomy. By recognizing that sentiment about a product's battery life or CPU speed flows upward to the company's valuation, the researchers unlocked a higher resolution of predictive power than "bag-of-words" models.
Limitations & Future Work
- Data Noise: The authors admit that very short or "meaningless" tweets still introduce noise.
- Timeline Gaps: The model excludes non-trading days (weekends/holidays), where sentiment continues to accumulate, creating a potential "lag gap."
- Multi-Platform: Future research should incorporate Facebook or Reddit, which allow for longer-form text and potentially more nuanced sentiment analysis.
This paper serves as a blueprint for "Sentiment Management"—suggesting that for tech giants, social media isn't just PR; it's a 3-day early warning system for the Nasdaq.