
Beyond Linear Regressions: Modeling Customer Quality Perception with Cellular Automata
Dynamics of Quality Perception in a Social Network: A Cellular Automaton Based Model in Aesthetics Services
This paper introduces a Cellular Automaton (CA) based model to simulate the dynamics of service quality perception within a social network, specifically in the aesthetics services industry. By modeling interactions between clients and providers as local transition rules, the study achieves a 73.80% prediction accuracy, outperforming traditional linear regression models.
TL;DR
Researchers have moved beyond static surveys to view service quality as a living, breathing ecosystem. By treating a social network of clients and providers as a Cellular Automaton (CA), this study successfully simulated how opinions evolve over time with 73.80% accuracy, revealing that dissatisfaction propagates through a network much like a contagion and that the "human element" follows non-linear patterns that traditional statistics simply miss.
Background: Why Linear Models Fail Social Science
In the world of management research, the gold standard has long been linear regression (e.g., SERVQUAL). However, social systems are complex systems where the "whole is greater than the sum of its parts." Traditional models struggle to explain why two identical service encounters might result in different quality perceptions. The authors argue that quality perception isn't just a result; it’s an emergent behavior born from local interactions and social "scripts."
Methodology: The Social Grid
The study focused on aesthetics clinics, a high-involvement service. They conducted two longitudinal surveys four months apart.
The CA Architecture
- Lattice: 36 individuals (clients and providers) across 7 intangible indicators (Trust, Honesty, etc.).
- States: 5-point Likert scale (1: Totally Disagree to 5: Totally Agree).
- The Rule: A radius-1 rule (interacting with immediate neighbors) was searched for using a random search heuristic starting from a "majority rule" (herd behavior).
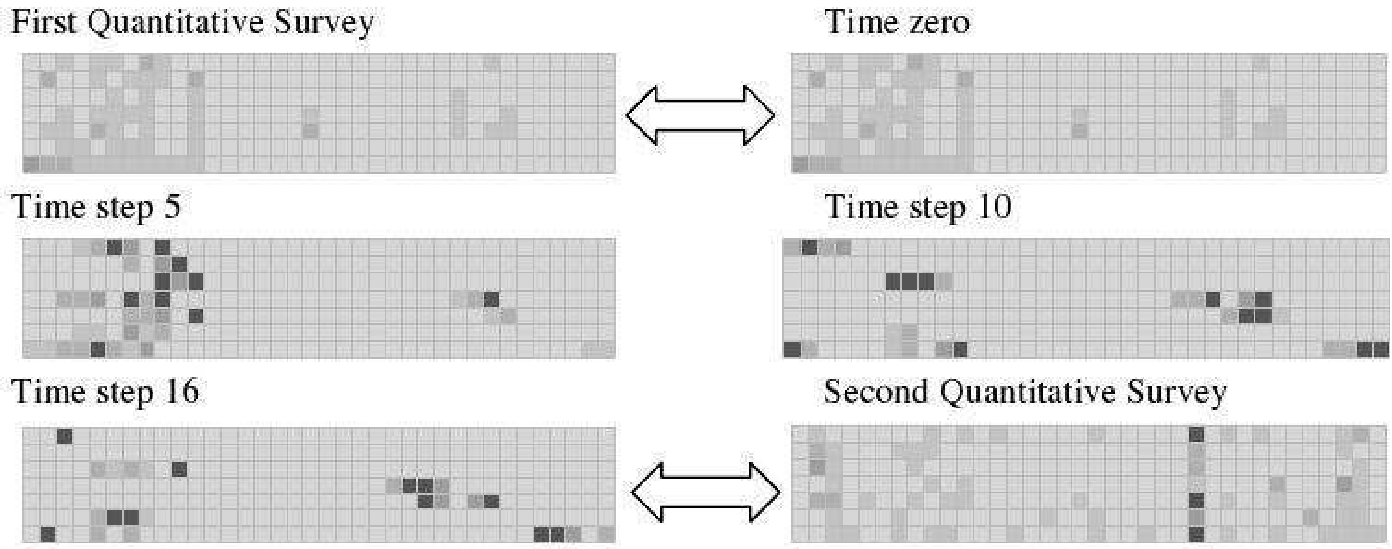 Caption: The CA lattice evolution showing how opinion states (shades of gray) shift across different service indicators over time.
Key Insights: The Anatomy of Dissatisfaction
The simulation didn't just match data points; it visualized the mechanics of social influence:
- The Contagion Effect: Dissatisfaction (represented by dark gray/black cells) often starts at the customer-provider interface and spreads. In indicators like "Honesty," the dissatisfaction spread wider than in "Attention," indicating that core values have a higher "transitivity" in social networks.
- The Consensus Emergence: Over 30 iterations, the network typically reaches an equilibrium. Interestingly, the "Euclidean distance" between opinions decreased, proving that repeated interaction breeds consensus—either everyone becomes happy, or the network "isolates" the malcontents.
- The Paradox of Mitigation: In a counter-intuitive finding, the model showed that inserting a "moderately dissatisfied" individual into a highly dissatisfied group was more effective at stabilizing the group than inserting a "perfectly satisfied" one. The latter often triggered further cognitive dissonance or "rebellion."
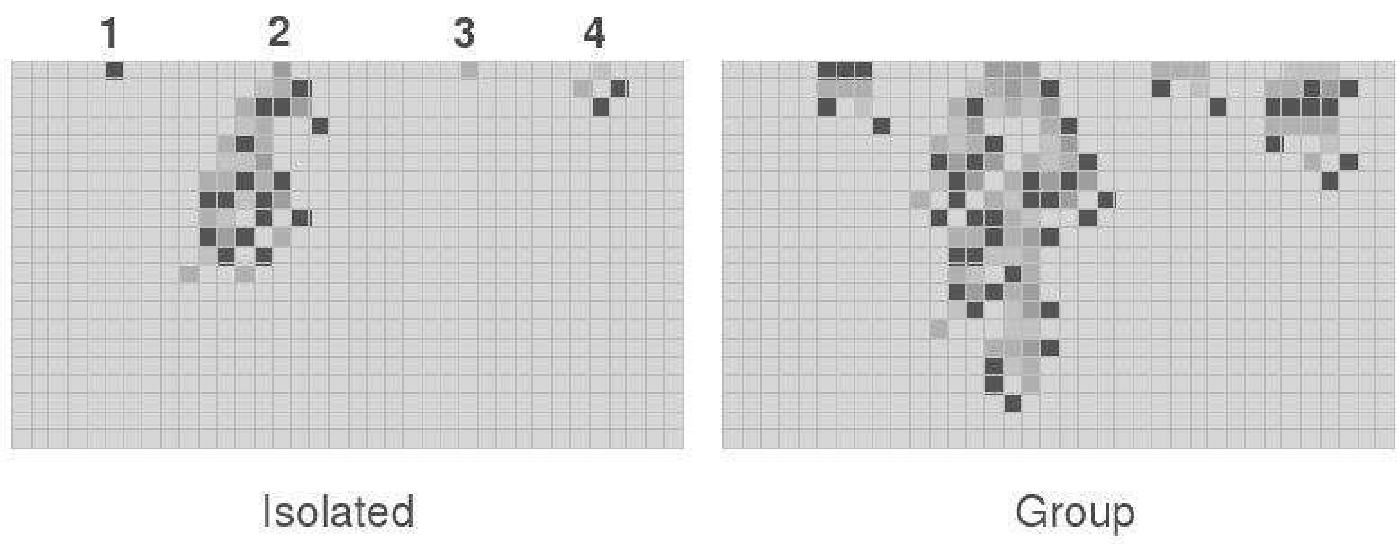 Caption: Simulation results demonstrating the influence of grouping vs. isolating dissatisfied individuals.
Clinical Results vs. Reality
The model achieved its peak accuracy at the 16th iteration (representing 16 weeks/4 months).
| Metric | Survey 1 | Survey 2 | CA Simulation |
|---|---|---|---|
| Mean Perception | 3.75 | 3.65 | 3.67 |
| Variance | 0.16 | 0.25 | 0.97 |
While linear regressions usually stop at explaining variance (reaching ~65% in this field), this CA model provided a case-by-case prediction at 73.80%, capturing the non-linear "swings" in customer mood that happen between survey points.
Critical Analysis & Future Outlook
Takeaway: This work demonstrates that Role Theory (the idea that we all follow scripts) can be mathematically modeled. It provides managers with a "social laboratory" to test interventions—like rearranging which staff members handle which "problematic" clients—before implementing them in real life.
Limitations: The current model uses a uniform rule (everyone follows the same script) and a circular lattice. Real-world social networks are "amorphous"—a client might talk to three providers and ten other clients simultaneously. Moving toward Non-Uniform CA or Graph-based Agent Models would be the logical next step to increase fidelity.
Conclusion: Service quality is not a static score; it is a dynamic state. By using Cellular Automata, we can finally begin to see the "outbreaks" of dissatisfaction and the "waves" of consensus that define the modern service encounter.