
F2GI: Quantifying Group Influence—Why Your "Digital Neighborhood" Dictates Your Next Move
Quantifying Group Influence on Individuals in Online Social Networks
The paper introduces F2GI, a Factor Graph-based Group Influence model designed to quantify how fine-grained "perceived groups" affect individual behaviors in online social networks. By categorizing social environments into following and interacting groups, the model achieves state-of-the-art performance in predicting retweet actions on Sina Weibo.
TL;DR
Social psychology suggests that our actions are rarely purely independent but are products of our social environments. This paper introduces the F2GI (Factor Graph-based Group Influence) model, which identifies your most impactful "perceived groups" and uses Factor Graphs to predict your next retweet with over 73% accuracy, significantly outperforming traditional machine learning methods.
The "Coarse-Grain" Problem in Social Influence
Most current research in Online Social Networks (OSNs) treats social influence as either a localized peer-to-peer event or a massive community-wide phenomenon. However, human cognition is limited. According to Dunbar's Number, we can only maintain a finite number of stable social relationships (roughly 150-180).
The authors argue that previous models were too "coarse." They missed the "perceived group"—the specific subset of people an individual actually notices and interacts with. To solve this, this research bridges the gap between social psychology and data science by defining two distinct group environments:
- Following Groups: Relatively stable social structures based on who you follow.
- Interacting Groups: Dynamic, "hot" environments based on recent retweets and comments.
Methodology: The F2GI Framework
The core of the paper is the Factor Graph-based Group Influence (F2GI) model. It doesn't just look at whether you follow someone; it calculates your perception of them based on path reachable distances and interaction frequency.
1. Fine-Grained Group Detection
The authors use a 3-ego network (friends of friends of friends) as a candidate set but trim it down to the "Top 180" based on a perception ranking algorithm. This aligns the model with the psychological reality of limited human attention.
2. The Factor Graph Architecture
The model translates group properties into a probabilistic graph. It utilizes three primary factor functions:
- f(v): Captures the stable "atmosphere" of your following group.
- g(v): Measures the dynamic intensity of your interacting group.
- s(v): Accounts for your individual psychological traits (e.g., dependency on others vs. autonomy).
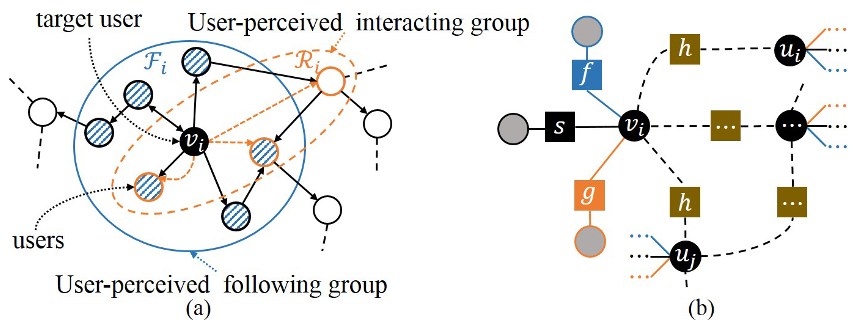 Above: The Factor Graph representation showing how individual behaviors (vi, uj) are linked via group and similarity factors.
Experiments: Proving the Power of Groups
The researchers tested F2GI on a massive dataset from Sina Weibo, involving 17,000 users and nearly 3 million social relations.
SOTA Comparison
When compared to traditional baselines, F2GI showed a massive leap in consistency. While Logistic Regression had decent precision, its recall was nearly zero because it couldn't handle the non-linear relationship between group influence and behavior. F2GI, however, found the "sweet spot."
| Algorithm | Precision | Recall | F1-Score |
|---|---|---|---|
| F2GI | 0.736 | 0.729 | 0.733 |
| BayesNet | 0.455 | 0.755 | 0.568 |
| RandomForest | 0.620 | 0.505 | 0.556 |
| Logistic | 0.682 | 0.040 | 0.075 |
What Matters Most? (Ablation Study)
The authors performed an ablation study by removing specific components:
- Removing Similarity Constraints (F2GI-C) caused precision to drop by 16.8%.
- This proves that users in similar group environments behave in fundamentally predictable ways. Your "neighborhood" acts as a powerful constraint on your behavioral range.
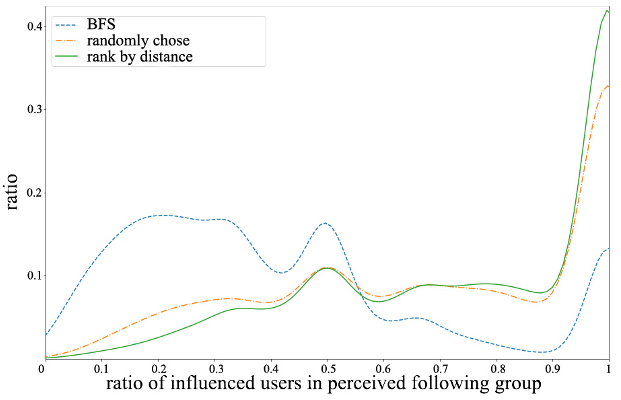 Above: Evidence showing that the "Perceived Following Group" method captures significantly more influential users than random or BFS selections.
Insights & Critical Analysis
The brilliance of this work lies in the MDLP Discretization. By converting continuous PCA values into discrete bins, the authors allowed the Factor Graph to learn the probability of influence between specific "cut points." This makes the model more robust than simple linear weights.
Limitations: While powerful, the model relies on a sliding window (T=10 days). In the hyper-fast world of viral memes, 10 days might be too long to capture the "interacting group" peaks. Future iterations could benefit from a Graph Neural Network (GNN) approach to learn these temporal embeddings automatically.
Conclusion
This paper is a strong reminder that we are social animals. By quantifying the "invisible" groups we perceive, the F2GI model offers a roadmap for everything from more ethical social media algorithms to more effective public health messaging. It isn't just about what you like; it's about what the 180 people you "perceive" are doing.