
Temporal Novelty: Mapping the Pulse of Public Opinion via Time-Varying Graphs
Quantifying Temporal Novelty in Social Networks Using Time-Varying Graphs and Concept Drift Detection
2020-01-01
Summary
Problem
Method
Results
Takeaways
Abstract
This paper proposes a novel framework to quantify temporal novelty in social networks by transforming textual data into Time-Varying Graphs (TVG) and subsequently into time series via a new metric called Temporal Novelty Quantification (TNQ). It combines Text Mining, Graph Theory, and a custom Concept Drift detection method to identify significant shifts in public opinion, achieving high correlation with real-world political events during the 2018 Brazilian elections.
## TL;DR
Researchers from the Federal University of Bahia and the University of São Paulo have unveiled a new method to track how "novel" information spreads in social networks. By transforming Tweets into weighted **Time-Varying Graphs** and applying a new metric called **Temporal Novelty Quantification (TNQ)**, they can pinpoint exactly when public discourse shifts in response to real-world events, effectively bypassing the noise of sheer volume.
## The Problem: Beyond the "Volume Trap"
In social media analysis, we often fall into the "Volume Trap." We assume that more tweets mean more importance. However, in an era of political polarization and bot-driven campaigns, volume can be misleading. Traditional methods like sentiment analysis often treat words in isolation or use "black-box" embeddings that obscure the *relationship* between topics.
The authors argue that the true "novelty" of a moment isn't just about how much people are talking, but **how the web of concepts they use is changing.** If words that were never used together suddenly become inseparable, a "Concept Drift" has occurred.
## Methodology: From Text to Temporal Graphs
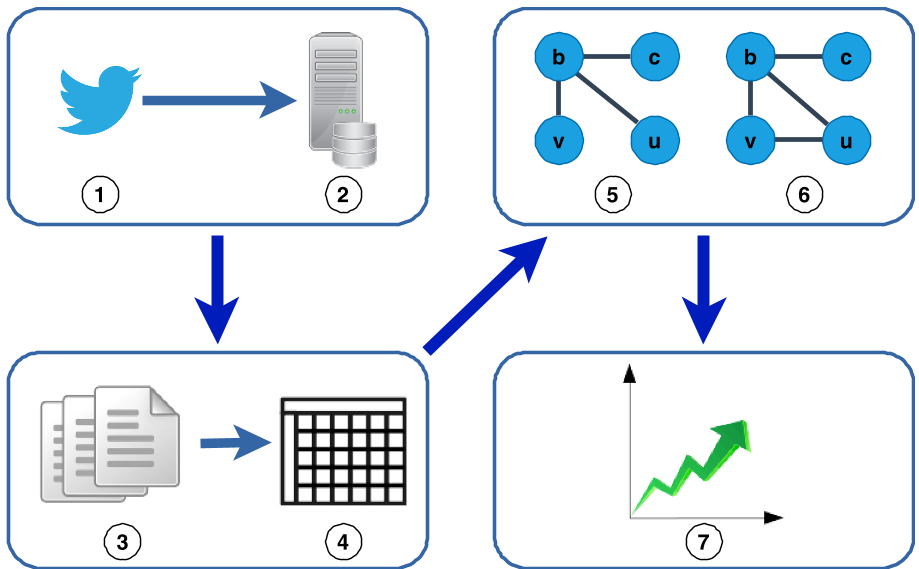
The proposed approach follows a rigorous four-phase pipeline:
### 1. Preprocessing & Text Mining
Standard NLP techniques (Stemmization, Lemmatization, Stopword removal) are used to distill raw tweets into core "terms." Importantly, the authors remove **Retweets**, focusing only on original contributions to capture genuine shifts in reaction.
### 2. Building the Time-Varying Graph (TVG)
The system builds graphs where:
* **Nodes (V):** Unique keywords/terms.
* **Edges (E):** Connections between words that appear in the same tweet.
* **Weights (w):** The frequency of those co-occurrences.
Instead of an aggregated static view, they use non-overlapping daily windows to see how the graph's structure "morphs" from day to day.
### 3. The TNQ Metric (The Core Innovation)
The authors define the Temporal Novelty Quantification ($\aleph$) as the sum of normalized distances between edge weights of consecutive graphs:
$$d(u, v) = \sqrt{|m_{u,v}(\mathcal{G}) - m_{u,v}(\mathcal{G}')|}$$
This isn't just looking at *if* a word is present, but *how its relationship strength* with other words fluctuates. A high $\aleph$ value indicates a major shift in the conversation—a novelty.
## Experimental Results: The 2018 Brazilian Election
The framework was tested on a high-stakes dataset: the 2018 Brazilian presidential election. By monitoring keywords associated with candidates Jair Bolsonaro and Lula, the system successfully identified major "drift points."
### Key Findings:
* **Event Correlation:** Spikes in TNQ values correlated perfectly with external events, such as the stabbing of Bolsonaro, the first round of voting, and major policy announcements.
* **Bot Detection Potential:** The researchers found that while volume spikes (retweets) are easy to manufacture, the **semantic relationship** (how diverse words are connected) is much harder for simple bots to mimic.
* **The "Identical Tweet" Problem:** As shown in the study, thousands of users often tweet the *exact same string*. This structural stagnation leads to lower TNQ, helping distinguish organic discussion from "copy-paste" activism.
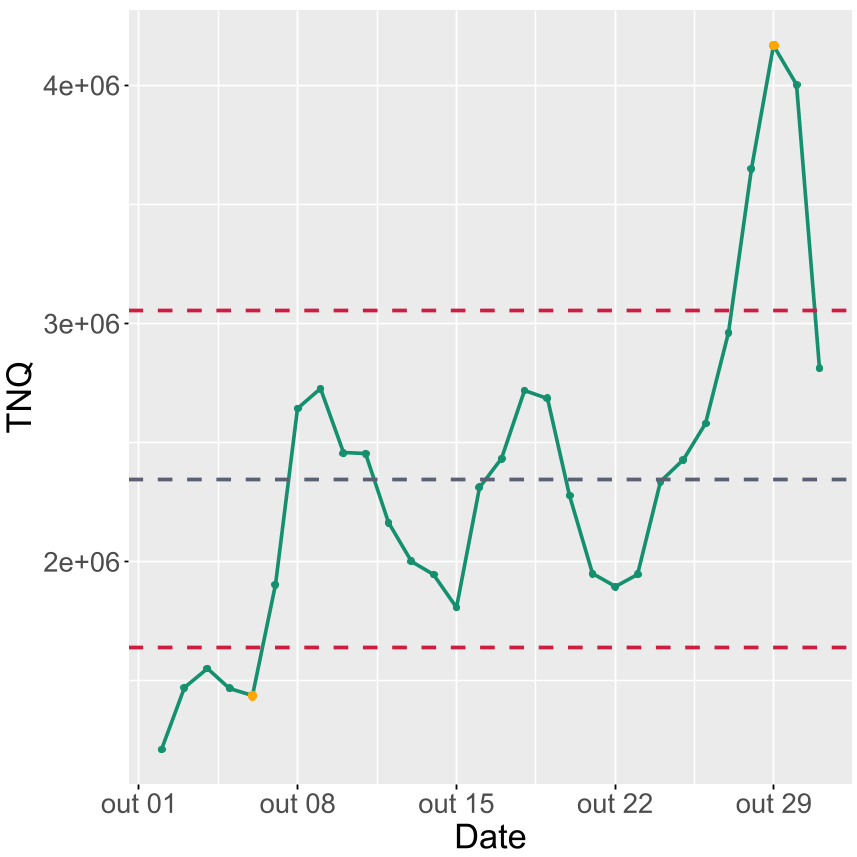
*The figure above illustrates the TNQ time series for Bolsonaro, highlighting identified concept drifts.*
## Critical Analysis & Conclusion
### Takeaway
The value of this work lies in its **transparency**. Unlike deep learning models that output a sentiment score, this graph-based approach allows researchers to look at the adjacency matrix and see *which specific word pairings* triggered the novelty detection.
### Limitations
The current model uses a daily granularity. In the fast-paced world of social media, "novelty" often happens in minutes. Moving toward a streaming, sub-hour window would increase the method's utility for real-time crisis management.
### Future Work
The authors suggest that TNQ could become a standard feature in **Bot Detection** systems. By identifying users whose TNQ remains suspiciously low or follows a rigid pattern, platforms could flag automated accounts that are programmed to repeat scripts rather than engage in evolving human discourse.
---
**Reference:** dos Santos, V. M. G., et al. "Quantifying Temporal Novelty in Social Networks Using Time-Varying Graphs and Concept Drift Detection."