
Evolutionary Reliability: Transforming Warranty Data into Customer Satisfaction Insights
Development, analysis and applications of a quantitative methodology for assessing customer satisfaction using evolutionary optimization
This paper develops a novel, quantitative methodology to derive a Customer Satisfaction Index (CSI) from automobile warranty and sales data using evolutionary optimization. By employing a bi-objective Genetic Algorithm (NSGA-II), the authors transform qualitative customer perceptions into a deterministic mathematical model that accurately ranks vehicle models and identifies critical service-related failures.
TL;DR
Automotive manufacturers often struggle to translate raw warranty claims into actionable design feedback. This paper presents a quantitative framework using Evolutionary Optimization to build a Customer Satisfaction Index (CSI) directly from service data. By moving beyond simple "failure counts," the model identifies which technical issues most damage the brand and provides a mathematical roadmap for design prioritization.
The Cognitive Gap in CRM
In the automotive sector, quality is often measured by metrics like IPTV (Incidents Per Thousand Vehicles). While useful for engineering, these numbers don't capture the feeling of a customer. A single expensive engine failure might cause more dissatisfaction than five minor oil leaks.
The authors argue that existing assessments are flawed because:
- Surveys are sparse: They only cover a tiny fraction of the customer base.
- Data is qualitative: Likert scales (1-5 ratings) are subjective and vary by individual.
- Closed-loop absence: There is no direct mathematical link between a specific bolt failing in the field and the resulting drop in market ranking.
Methodology: Mining Sentiment from Service Records
The core innovation lies in the Feature Extraction and the Evolutionary Search for a satisfaction function.
1. The Six Pillars of Satisfaction
The authors identified six features from sales and service data:
- Visit Frequency: How often does the owner return to the dealer?
- Downtime: Total days the vehicle was unavailable.
- Total Cost: Cumulative repair expenditure.
- Time Intervals: Average days between failures.
- Mileage Intervals: Average miles run between visits.
- Severity Ratings: Expert-assigned weights for different repair types (1-5).
2. The Optimization Engine
The paper defines the CSI as a function . To find the best , they use NSGA-II, a multi-objective genetic algorithm. The goal is two-fold:
- Primary Objective: Minimize variance () and skewness () of the CSI distribution across a single vehicle model. Intuition: most owners of the same car should have a similar perception.
- Secondary Objective: Maximize the difference in mean CSI between different vehicle models to enable ranking.
Results: Validation Against Industry Standards
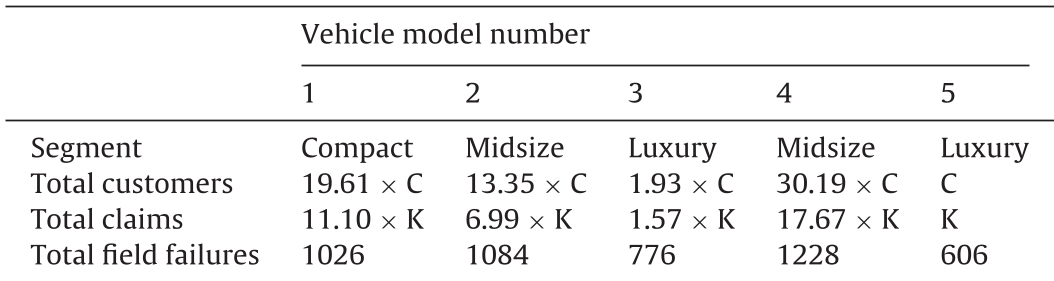
The model's output was compared against Consumer Reports reliability rankings. The mathematical model retrieved the exact same ranking order:
A key finding was the Sensitivity Analysis. While engineers often focus on reducing service time (downtime), the model revealed that the Sum of Severity Ratings and Total Repair Costs are significantly more critical to the "Extremely Satisfied" customer segment.
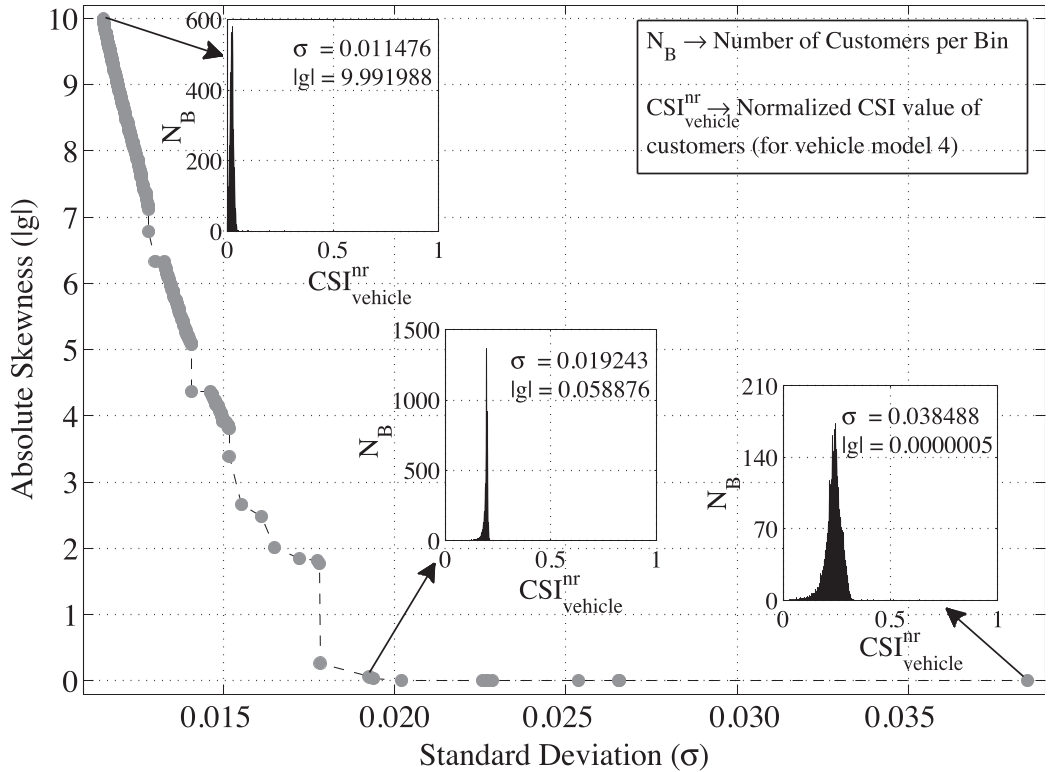 The trade-off fronts show the balance between variance and skewness. The 'knee point' represents the most balanced model for each vehicle.
Applications: CSI Improvement Potential (CIP)
The paper introduces the CIP (CSI Improvement Potential). This allows managers to ask "What If" questions:
- "If we redesign the transmission to eliminate code 'rc', by what % will our market satisfaction grow?"
By simulating the removal of specific failure codes, the authors found that frequency does not always equal impact. Some rare but high-severity failures have a higher CIP than frequent minor issues.
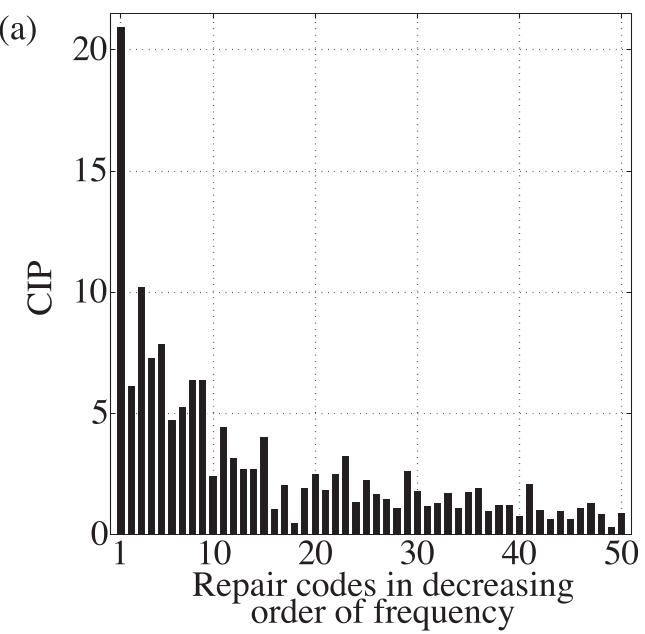 This bar chart allows engineers to prioritize design changes based on their direct impact on the Customer Satisfaction Index.
Critical Analysis & Conclusion
This study provides a robust algorithmic bridge between the workshop and the design studio.
- Strengths: It uses existing data (warranty records) without requiring new expensive surveys. It employs rigorous statistical validation (Welch’s t-test and Tukey-Kramer).
- Limitations: The model assumes that "no service record" equals "high satisfaction," which ignores customers who take their vehicles to third-party mechanics or simply live with a defect.
- Future Outlook: As vehicles become software-defined, this evolutionary approach could be applied to Over-the-Air (OTA) logs, allowing manufacturers to fix "digital failures" before the customer even perceives a drop in satisfaction.
By quantifying the "qualitative," this research ensures that the voice of the customer is heard through the language of mathematics.