
Hypergraph Node Ranking: Accelerating Influence Analysis via Rank Consensus
Rank Consensus Between Importance Measures in Hypergraph Model of Social Network
This paper introduces a method to identify Rank Consensus between different node importance measures in Hypergraph models of social networks. By converting hypergraphs to primal Gaifman graphs, the authors demonstrate that computationally expensive centrality measures (like Betweenness) can be accurately approximated using efficient local measures (like Degree).
TL;DR
Analyzing influence in social networks often relies on complex centrality measures that are computationally expensive. This paper demonstrates that in Hypergraph models—which better represent group dynamics than simple graphs—there is a high degree of rank consensus between measures. Specifically, the authors find that simple Degree Centrality can approximate Betweenness and Closeness with high accuracy (over 98% correlation), offering a shortcut for identifying influential entities in complex group structures.
The "Group" Problem in Social Networks
Most social network analysis treats connections as dyadic (one-to-one). However, real-world interactions often happen in groups—think of a research paper with five authors or a group chat.
- The Limitation: Simple graphs lose the "group" context by breaking it into multiple independent pairs.
- The Solution: A Hypergraph uses "hyperedges" that can connect any number of nodes simultaneously, preserving the super-dyadic nature of group interactions.
However, measuring which node is "most important" in a hypergraph is mathematically taxing. The authors ask: Can we use a fast, local calculation to predict a slow, global one?
Methodology: From Hypergraph to Gaifman Graph
To analyze the importance measures, the authors first generate random connected hypergraphs and then map them to a lower level of abstraction called a Gaifman Graph.
- Hypergraph Construction: Using an incidence matrix to ensure high cardinality (at least 3 nodes per edge).
- Clique Transformation: Every hyperedge is converted into a clique (a subset where every node is connected to every other node) in the Gaifman graph. This allows traditional graph algorithms to run while maintaining the connectivity established by the group relations.

Identifying the Consensus Groups
The core contribution is the comparison of five key measures:
- DC (Degree Centrality): Local connectivity.
- CC (Closeness Centrality): Distance to all other nodes.
- BC (Betweenness Centrality): Role as a "bridge" in shortest paths.
- CN (Core Number): Degeneracy-based importance (k-shell).
- Cas_C (Cascade Capacity): Information diffusion potential.
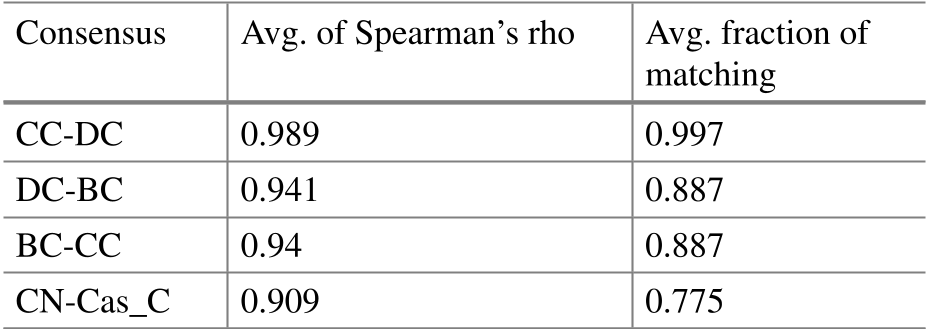
The authors implemented a consensus algorithm (Algorithm 3) to find how often different ranking methods agreed on the "top" nodes.
Deep Insight: The Value of Correlation
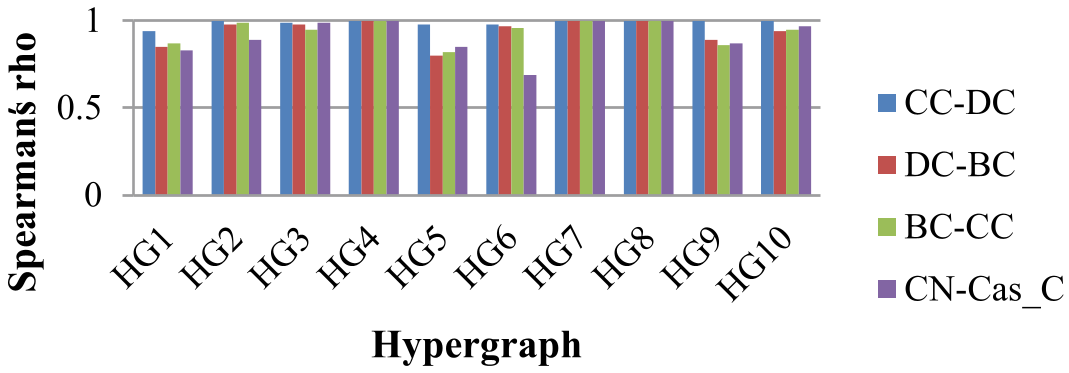
The results revealed a transitive closure dependency between Closeness, Degree, and Betweenness.
- The {BC, CC, DC} Trio: These measures are highly correlated. This is a massive win for performance: computing Degree Centrality is , while Betweenness can reach . On a hypergraph converted to a large Gaifman graph, this difference is the difference between seconds and hours of computation.
- The {CN, Cas_C} Pair: Core Number (via k-shell decomposition) is a reliable proxy for how well a node can spread information (Cascade Capacity).
Critical Analysis & Conclusion
Takeaway
The study proves that for random hypergraph models, Local and Semi-Global measures (DC, CN) are sufficient to approximate Global measures (CC, BC, Cas_C). If you need to find the most influential person in a group-based social network, you likely don't need to run multi-hour shortest-path simulations; looking at their direct group connections may be enough.
Limitations
- Synthetic Data: The study relies on "Random Hypergraphs." Real-world social networks often follow power-law distributions or small-world properties which might alter the correlation strengths.
- Information Retrieval: Converting a hypergraph to a Gaifman graph is a "lossy" transformation—it loses the specific group boundaries (subset information).
Future Outlook
This research creates a foundation for Approximation Algorithms in network science. Future work should investigate if these correlations hold in directed hypergraphs or temporal networks where group memberships change over time.