
Beyond Points on a Map: Region-Based Landmark Discovery via Crowdsourcing
13820_Region-based landmark discovery by crowdsourcing geo-referenced photos.
This paper introduces a region-based landmark discovery model that identifies geographic boundaries of attractions by crowdsourcing geo-referenced photos from Flickr. Unlike traditional point-based clustering, it utilizes Gaussian kernel convolution and adaptive thresholding to estimate precise landmark shapes, achieving over 90% discovery accuracy for major city attractions.
TL;DR
This research shifts the paradigm of landmark discovery from point-based clustering to region-based estimation. By leveraging the "wisdom of the crowd" through 700k+ Flickr photos, the authors utilize Gaussian kernels to define the actual spatial footprint of landmarks, successfully identifying over 90% of attractions in major cities like New York and Taipei.
Background: Why Points Aren't Enough
When you search for "Central Park" on a traditional map, you often see a single pin. In reality, Central Park is a 3.4 square kilometer rectangle. Previous academic efforts, such as the seminal work by Crandall et al. (WWW 2009), primarily focused on point-based models. These methods use clustering (like Mean-Shift) to find the "center" of a landmark. However, this ignores the structural reality of the world: night markets are linear, parks are polygonal, and trails are irregular.
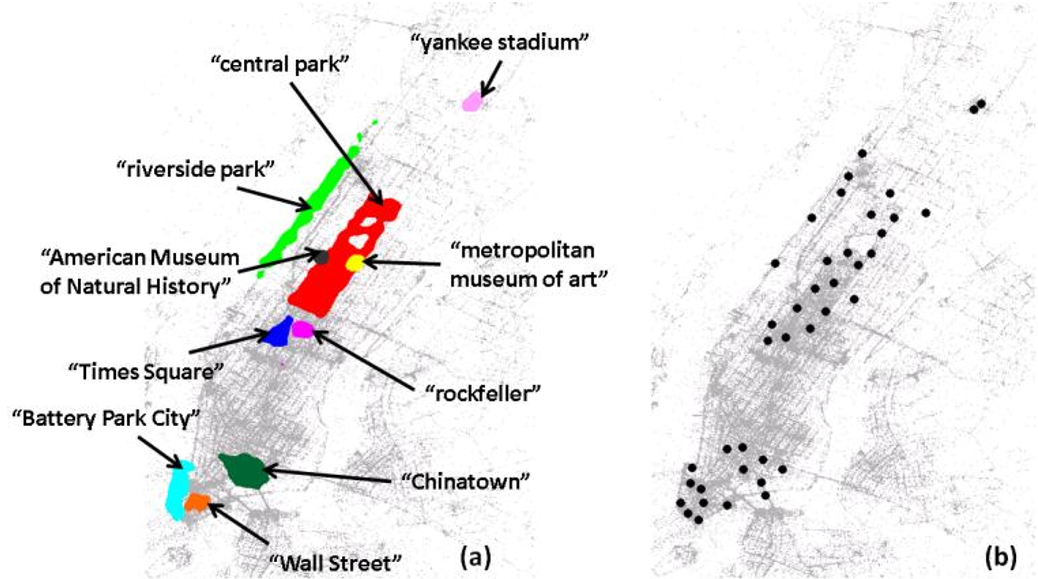 Figure 1: Comparison between (a) the proposed region-based discovery and (b) traditional point-based clustering. Note how the proposed method captures the rectangular shape of Central Park.
Methodology: From Noisy Tags to Clean Boundaries
The researchers' approach rests on a simple physical intuition: The density of photos taken is a proxy for the landmark's physical presence.
1. Gaussian Kernel Convolution
The raw data (geo-tagged coordinates) is extremely noisy. People might tag a photo "Central Park" while standing across the street. To solve this, the authors apply a 2D Gaussian Kernel. This acts as a low-pass filter, smoothing out isolated outliers while reinforcing dense, contiguous photo clusters.
2. Region Segmentation
After convolution, the map is treated as a continuous intensity surface. The system defines a threshold to segment the regions. If a pixel's value exceeds , it's included in the landmark region. This allows the model to "grow" boundaries that naturally fit the data distribution.
3. Smart Tag Mining
Not every popular tag is a landmark (e.g., "birthday" or "wedding"). The authors use a two-step filter:
- Weak Filter: Aggregates by date, frequency, and number of unique authors.
- Spatial Constraint: Evaluates the dispersion of detected regions. A true landmark should be concentrated, not scattered randomly across a city.
Experimental Insights: The "Skyscraper" Problem
The team evaluated their work against ground truth from Wikimapia. The results revealed a fascinating aspect of human behavior in "Crowdsourcing":
| Landmark | F1 Score | Insight |
|---|---|---|
| Central Park | 0.8436 | Excellent for large, accessible regions. |
| Brooklyn Bridge | 0.1081 | Poor score because people take photos of the bridge from the adjacent bridge. |
| Taipei 101 | 0.2157 | Skyscrapers are photographed from far away to fit them in the frame. |
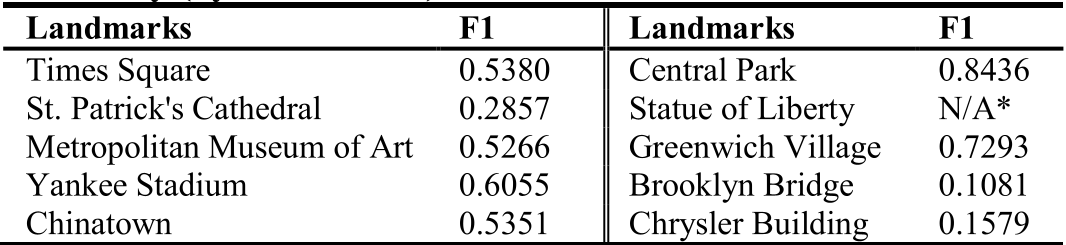 Table 1: Quantitative results for Manhattan landmarks. The high F1 for parks vs. low F1 for bridges highlights the "photographer's perspective" bias.
Critical Analysis & Conclusion
The true innovation of this paper is the move toward non-rigid boundary discovery. By using Gaussian convolution, the authors successfully bypassed the limitations of fixed-radius circles.
Limitations:
- The Perspective Gap: As seen with the Brooklyn Bridge and Taipei 101, the method discovers where photographers stand, which isn't always where the landmark is.
- Indoor Bias: Heavily dependent on GPS availability, which fails for indoor landmarks or dense "urban canyons."
Future Outlook: This work lays the foundation for "Dynamic Maps" that can update themselves as new nightlife districts or "pop-up" attractions emerge, far faster than any manual survey could achieve.