
Intelligent Regional Planning: A Decision Support Framework for Agricultural Economics
ANALYSIS AND ASSISTANT PLANNING SYSTEM OF REGIONAL AGRICULTURAL ECONOMIC INFORMATION
The paper presents a comprehensive Decision Support System (DSS) designed for regional agricultural economic planning. It integrates Comparative Advantage Theory, GIS, and Linear Programming to assist local governments in optimized agricultural structure adjustment and forecasting.
TL;DR
This paper introduces an integrated Decision Support System (DSS) that combines economic theory with information technology to solve the "what to plant where" dilemma. By leveraging Comparative Advantage Theory, GIS spatial analysis, and Linear Programming, the system provides local governments with a scientific toolkit to optimize agricultural structures and maximize rural income.
Background: Beyond the Spreadsheet
In regional development, decision-makers often drown in data tables but lack "insight." Traditional planning is frequently top-down and ignores the nuanced competitive advantages of specific locales. This work transitions agricultural planning from a "planned economy" mindset—focused purely on output volume—to a modern "market economy" approach, where the primary objective is the maximization of farmer income.
Methodology: The Analytical Engine
The core of the system is built upon three pillars of analysis that transform raw data into strategy.
1. Comparative Advantage Analysis
The system doesn't just look at who grows the most; it looks at who grows it most efficiently relative to the rest of the country. This is quantified through three critical indexes:
- Yield Advantage Index (YAI): Measures productivity/efficiency.
- Scale Advantage Index (SAI): Measures the degree of specialization and concentration (Location Quotient).
- Complicated Advantage Index (CAI): A composite metric that represents overall regional competitiveness.
2. Spatial Expression (GIS)
The authors argue that "patterns and trends for decision-making can't be found in data tables." By integrating GIS, the system generates:
- Areal Maps: Regional heatmaps for single-variable comparison.
- Bar/Pie Charts: Multi-variable spatial analysis to distinguish crop distributions across different counties.
3. Optimization via Linear Programming
To bridge the gap between analysis and action, the system employs Linear Programming. The target function (Z) is set to maximize total income, constrained by land resources, labor availability, and market variables.
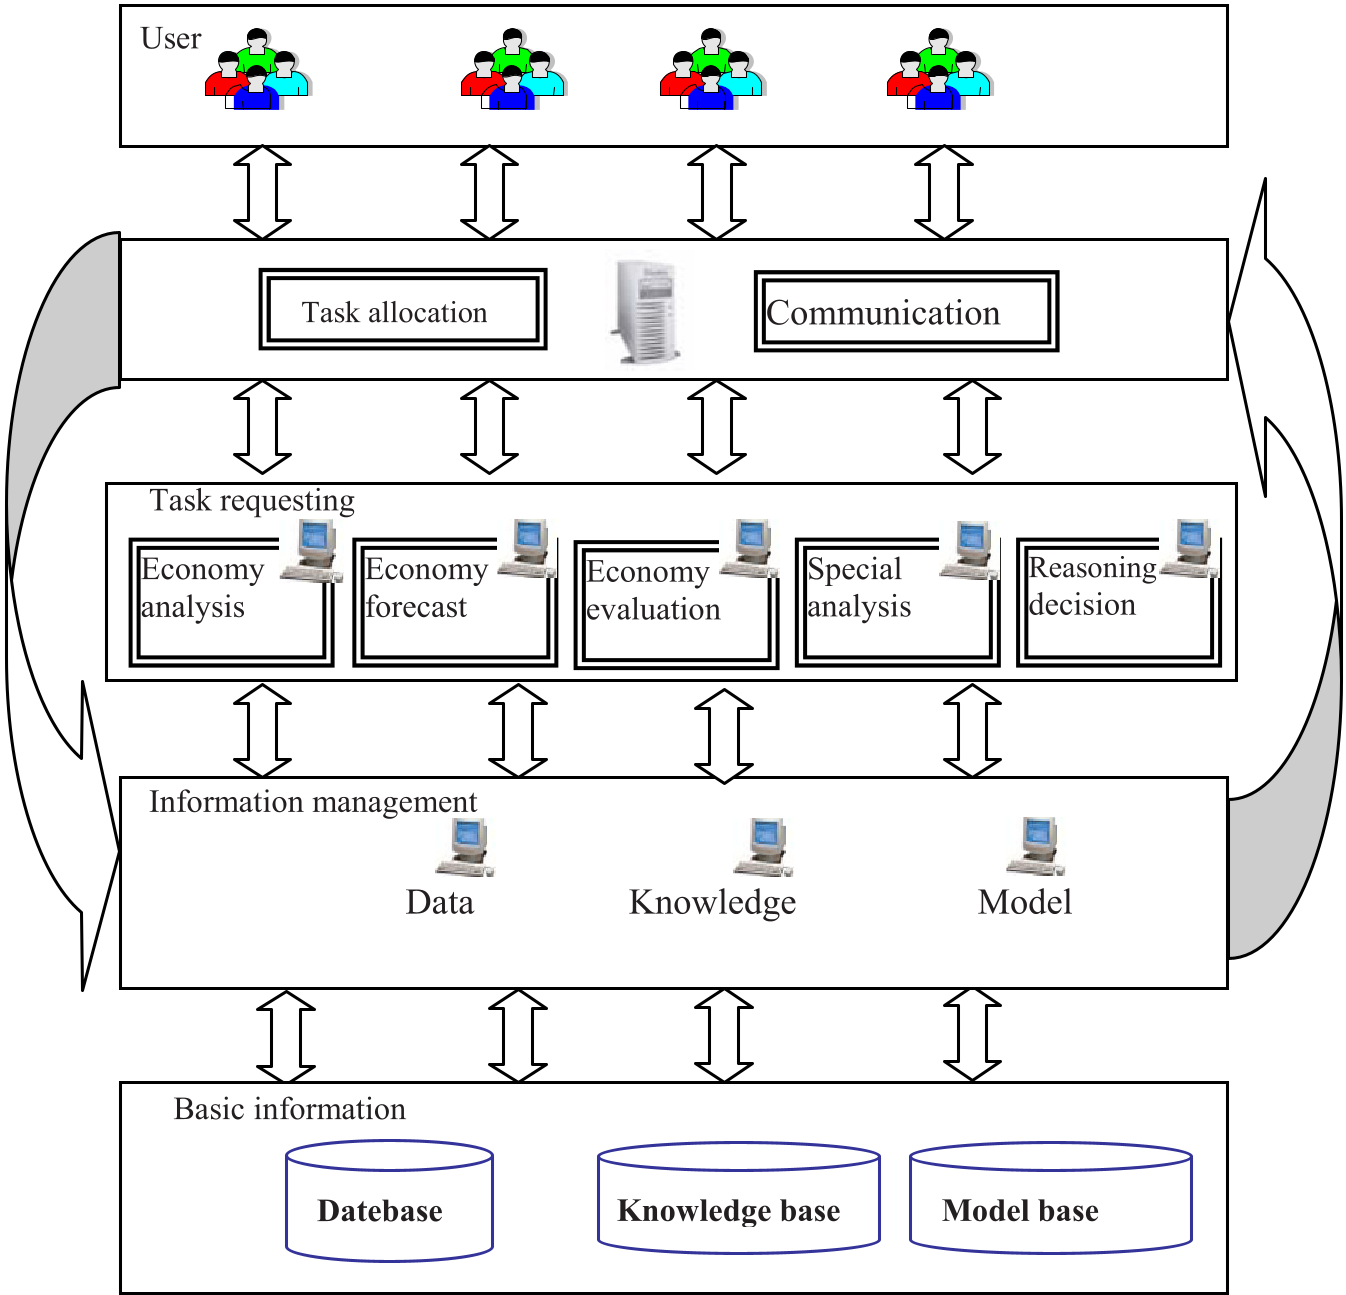 Figure 1: The 5-layer system architecture illustrating the flow from basic info to user communication.
System Architecture & Implementation
The system is built on a B/S (Browser/Server) structure using the Java EE SSH (Struts-Spring-Hibernate) framework. This choice emphasizes:
- Practicability: Easy deployment for local government offices.
- Extensibility: A multi-subsystem design based on a shared knowledge base.
- Separation of Concerns: Decoupling the complex algorithmic "Task Assignment" layer from the user interface.
Critical Insight: The Shift to AI
One of the most profound takeaways from the paper's conclusion is its nod toward Artificial Intelligence. The authors mention the use of BP Neural Networks for predicting stress-strain relationships in oilseeds, achieving a remarkably low maximum error of 0.0084. This signals a transition from purely deterministic linear models to "intelligent" agricultural forecasting that can handle non-linear market and environmental variables.
Conclusion & Future Outlook
The "Analysis and Assistant Planning System of Regional Agricultural Economic Information" serves as a bridge between high-level economic theory and practical governance. While the current model relies heavily on Linear Programming, the integration of AI and RS (Remote Sensing) suggests a future where regional planning is dynamic, real-time, and highly automated.
Limitations
- Data Latency: The effectiveness of the system is highly dependent on the timeliness of input-output tables from provincial statistics.
- Market Volatility: While the model optimizes for income, global market price fluctuations can be difficult to predict within a static linear constraint.
Final Takeaway
For researchers and developers in AgTech, this paper reinforces that spatial context is everything. Developing tools that can visualize "advantage" rather than just "output" is the key to sustainable regional growth.