
Earth’s Shifting Palette: A 15-Year Multi-Angle View of Our Changing Planet
Regional Changes in Earth's Color and Texture as Observed from Space over a 15- year Period
This study utilizes 15 years of multi-angle radiance data from the Multi-angle Imaging SpectroRadiometer (MISR) to detect decadal trends in Earth’s visual appearance. It identifies statistically significant "blueing" and "smoothing" trends globally, while uncovering much larger regional shifts in color and texture that serve as direct indicators of climate system changes.
TL;DR
By analyzing 15 years of direct radiance data from the MISR instrument, researchers have discovered that Earth is physically changing its "visual signature." The planet is becoming globally bluer and smoother, with intense regional fluctuations—such as a 15% increase in texture in the Arctic—reflecting profound shifts in cloud types, aerosol concentrations, and ice cover.
Background: Beyond the "Black Box" of Climate Algorithms
Typically, when we talk about climate change, we refer to Essential Climate Variables (ECVs) like cloud optical depth or aerosol levels. However, these are not "measured"; they are "retrieved" using mathematical models that often assume clouds are flat, one-dimensional sheets—a known oversimplification.
This study takes a step back to the source: Radiance. By looking at the raw light reflected from Earth, the authors eliminate the "middle-man" of algorithmic bias, providing the most robust evidence to date of decadal variability in Earth’s appearance.
The Problem: Why "Standard" Satellite Data Can Be Deceptive
Conventional satellite products are prone to:
- Algorithm Bias: Threshold-based cloud detection can misidentify thin clouds as aerosols.
- Geometry Ignoring: Most satellites look only downward (nadir), missing the 3D structure (texture) of the atmosphere.
- Instrument Drift: Calibration changes over decades can look like climate trends.
The authors solve this by using the Multi-angle Imaging SpectroRadiometer (MISR), which views the same spot from nine different angles, allowing them to see the "sides" of clouds and measure spatial texture with unprecedented stability.
Methodology: Measuring Color and Texture
The team analyzed three key metrics:
- Color (dĨ): Specifically the Difference in Scaled Anomalies between blue and red bands. A positive trend means the region is appearing "bluer."
- Texture (T): Calculated as the ratio of standard deviation to mean radiance. High texture indicates "rougher" scenes (like puffy cumulus clouds); low texture indicates "smoother" scenes (like flat stratus clouds or clear deserts).
- Angular Dependency: Comparing the nadir (downward) camera with oblique (angled) cameras (DA and DF).
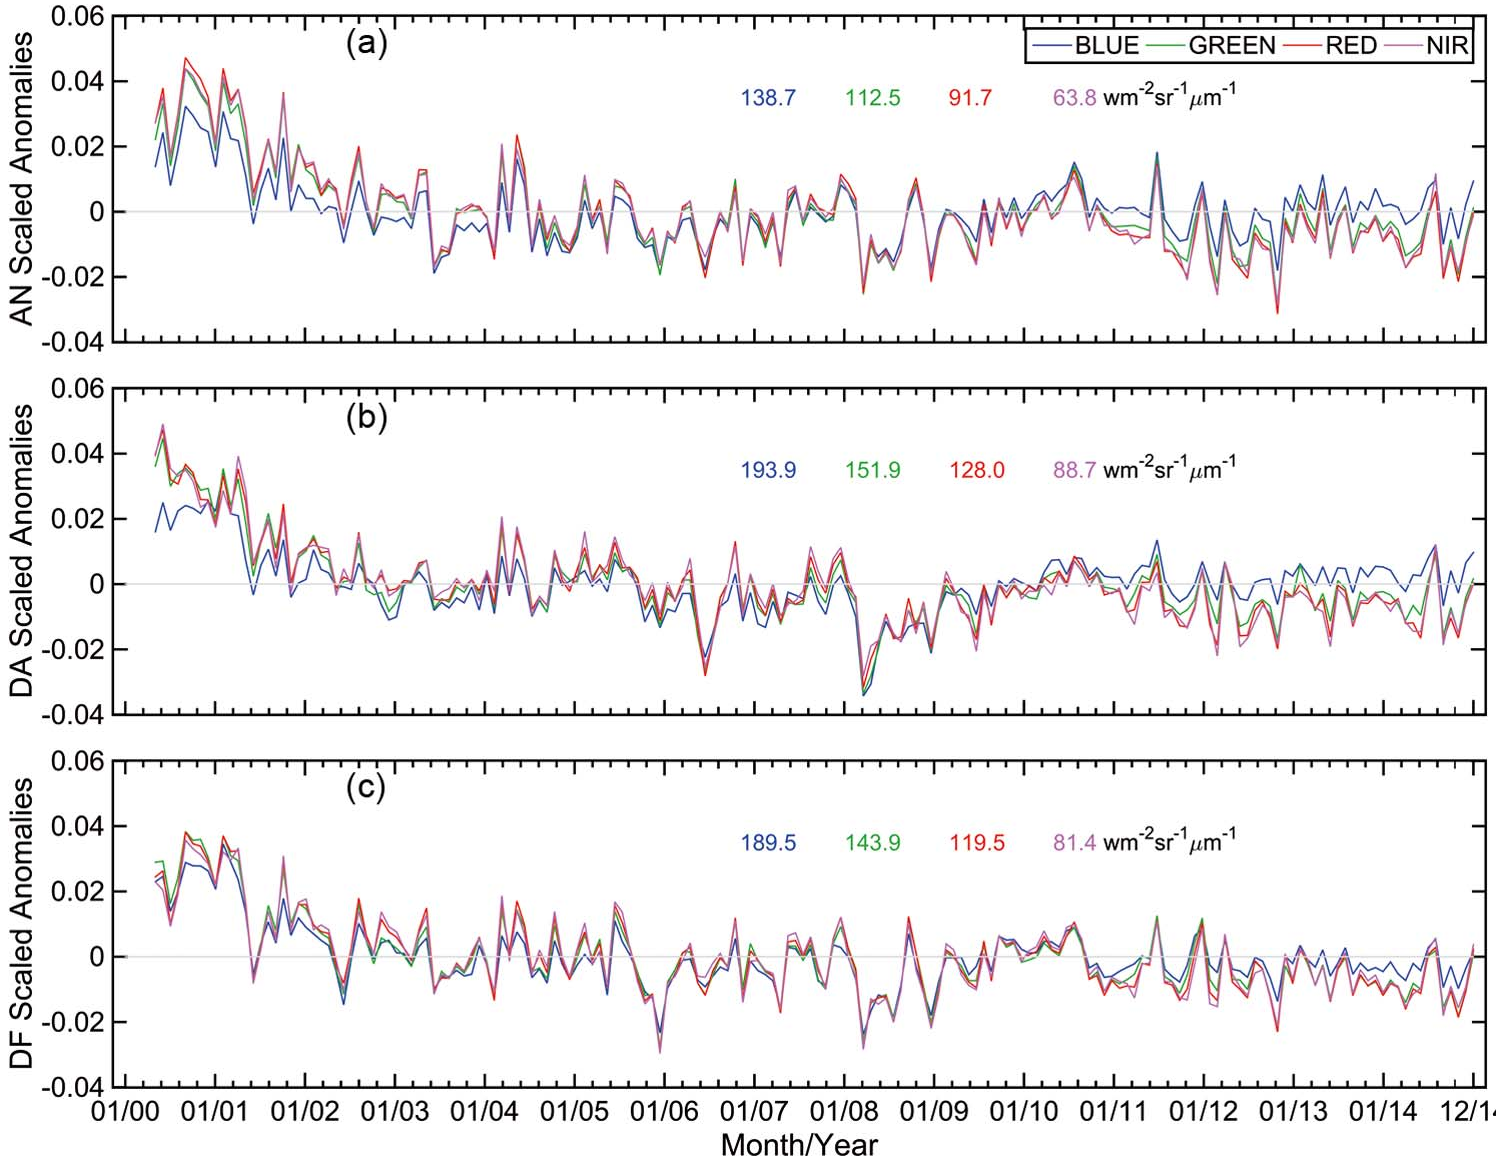 Fig 1. Global spatial distribution of trends in Earth's color. Bluer regions indicate a shift toward shorter wavelengths, often linked to cloud thinning or surface changes.
Key Insights: Blueing, Smoothing, and Roughing
1. The Global Blueing Trend
Globally, the Earth has appeared bluer by up to 1.6% per decade. While this borders on instrument calibration limits, the regional patterns are so strong they must be physical.
2. The Arctic's Radical Transformation
The Arctic Ocean showed a 15% increase in texture per decade. Why? As sea ice melts, the surface transitions from a flat, smooth white sheet to a complex mix of dark water and broken ice, significantly "roughening" the planet's visual signature.
3. The "Smooth" Tropics
A broad region from the Arabian Peninsula to Southeast Asia has become significantly smoother (-20% per decade) in oblique views. This suggests a widespread change in "macrophysical" cloud properties—potentially an increase in thin, high-altitude cirrus clouds that mask vertical heterogeneity.
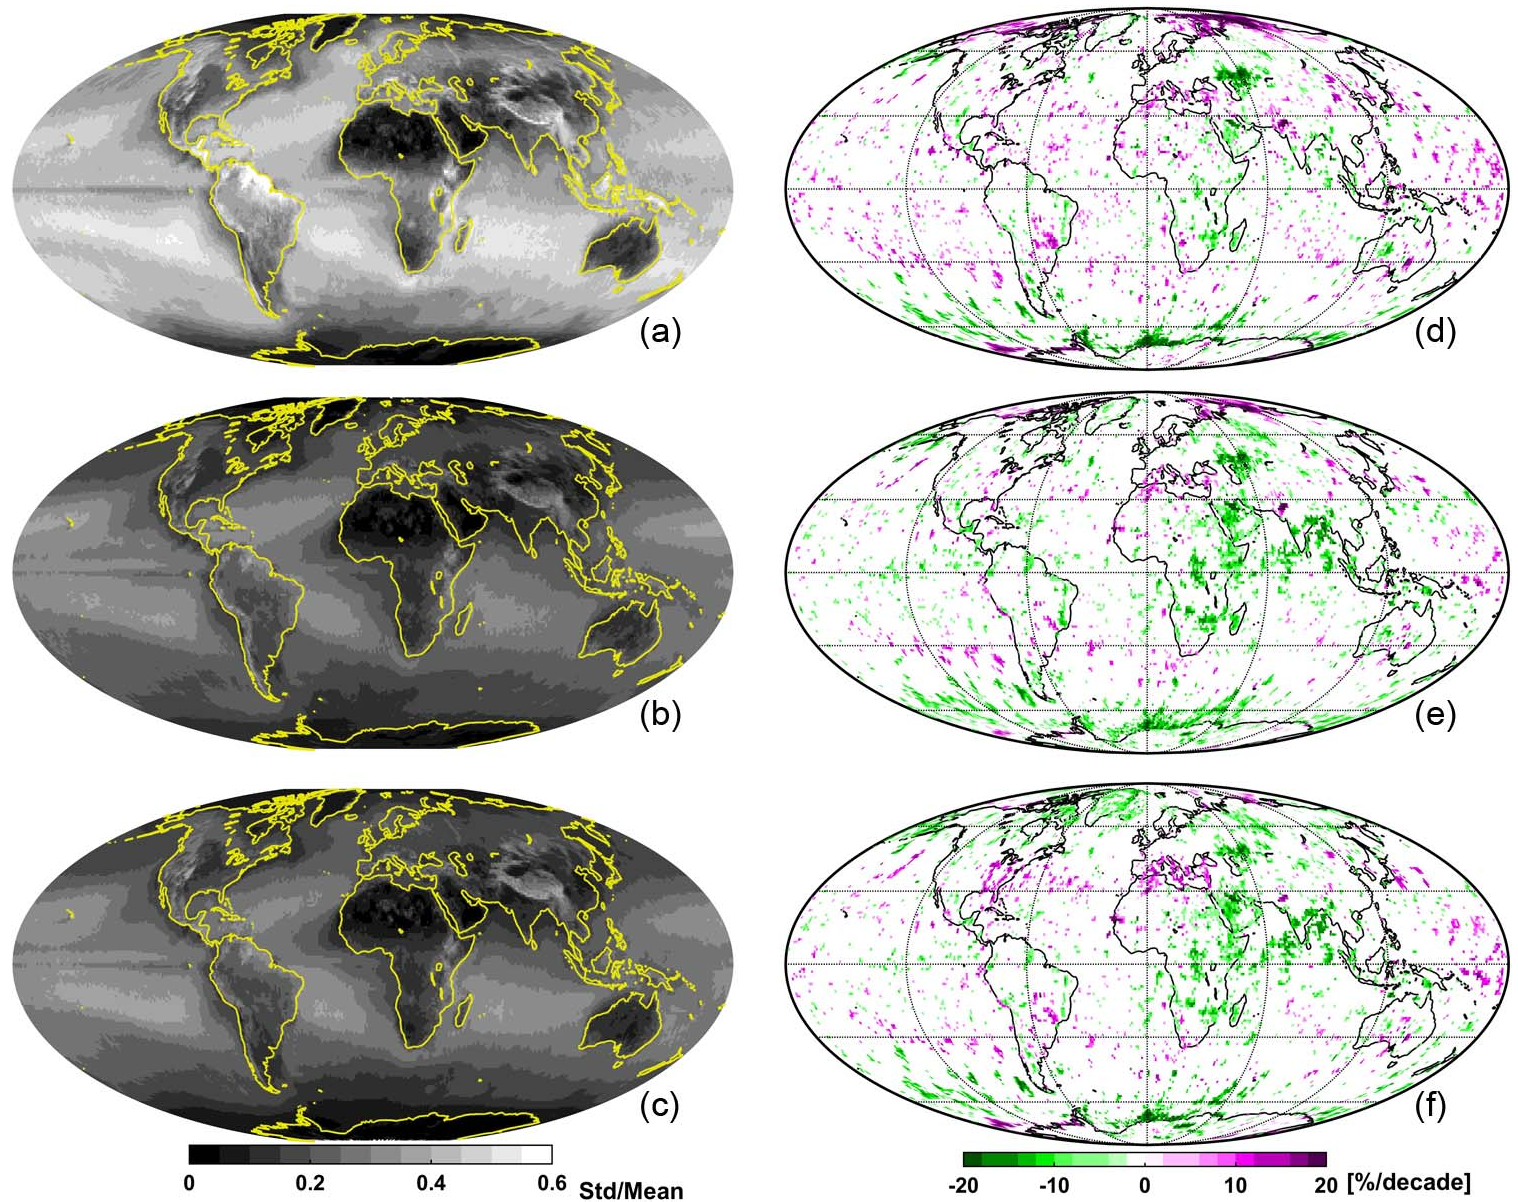 Fig 2. Mean texture (T) mapped globally. Notice high texture in the "cloud streets" of subtropical highs.
Critical Analysis: Why This Matters
The most striking finding is the shift along the subtropical highs. The authors observed a 5-degree wide band of "blueing and roughening" at the edges of the tropics. This is visual evidence of the Hadley Cell expansion—the tropics are literally growing, pushing dry, clear-sky regions poleward and changing the very "fabric" of the global cloud bank from flat decks (stratus) to scattered towers (cumulus).
Conclusion and Future Outlook
This paper proves that the Earth is not a static "Blue Marble." Its colors are shifting, and its textures are smoothing out in some places while roughening in others.
- The Takeaway: Future climate satellites should not just measure how much light comes back, but from what angle and with what spatial pattern.
- Limitations: A 15-year window is a "snapshot" in climate terms. Long-term attribution to specific phenomena like ENSO requires multi-decadal data.
The "visual" change of the Earth is more than an aesthetic observation; it is a direct diagnostic of the energy balance and circulation patterns that govern our climate.