
Beyond Random Splits: Why Spatial Autocorrelation is the Silent Killer of Yield Prediction Models
Regression Models for Spatial Data: An Example from Precision Agriculture
This paper introduces a spatial cross-validation framework for yield prediction in Precision Agriculture, utilizing Support Vector Regression (SVR), Random Forests, and Bagging. The core contribution is a spatial clustering-based sampling method that prevents data leakage caused by spatial autocorrelation, achieving more realistic error estimation on agricultural datasets F440 and F611.
TL;DR
In the world of Precision Agriculture, data is rarely independent. This paper reveals that standard machine learning evaluation—like random k-fold cross-validation—drastically underestimates errors (by up to 100%) because it ignores Spatial Autocorrelation. By introducing a novel spatial clustering-based sampling method, the authors provide a more honest benchmark for yield prediction using SVR and Random Forests.
The "Independence" Trap in Agritech
Most data scientists are trained on a fundamental lie: the assumption that data points are Independent and Identically Distributed (I.I.D.). When dealing with a field of wheat, if you know the nitrogen level at point A, you can bet point B (just 10cm away) is nearly identical.
When we use a standard random split for training/testing, the model "cheats." It sees point A in training and point B in testing. Because they are virtually the same, the model appears to have high accuracy, but it has actually just memorized the neighborhood. This is the Inductive Bias problem of spatial data.
Methodology: Spatially-Aware Cross-Validation
To solve this, the authors don't change the underlying regression models (SVR, Random Forests); instead, they change how the models see the data.
1. Spatial Tesselation
Using k-means clustering on nothing but the GPS coordinates (Longitude and Latitude), the field is carved into "Zones." These zones represent geographically distinct clusters.
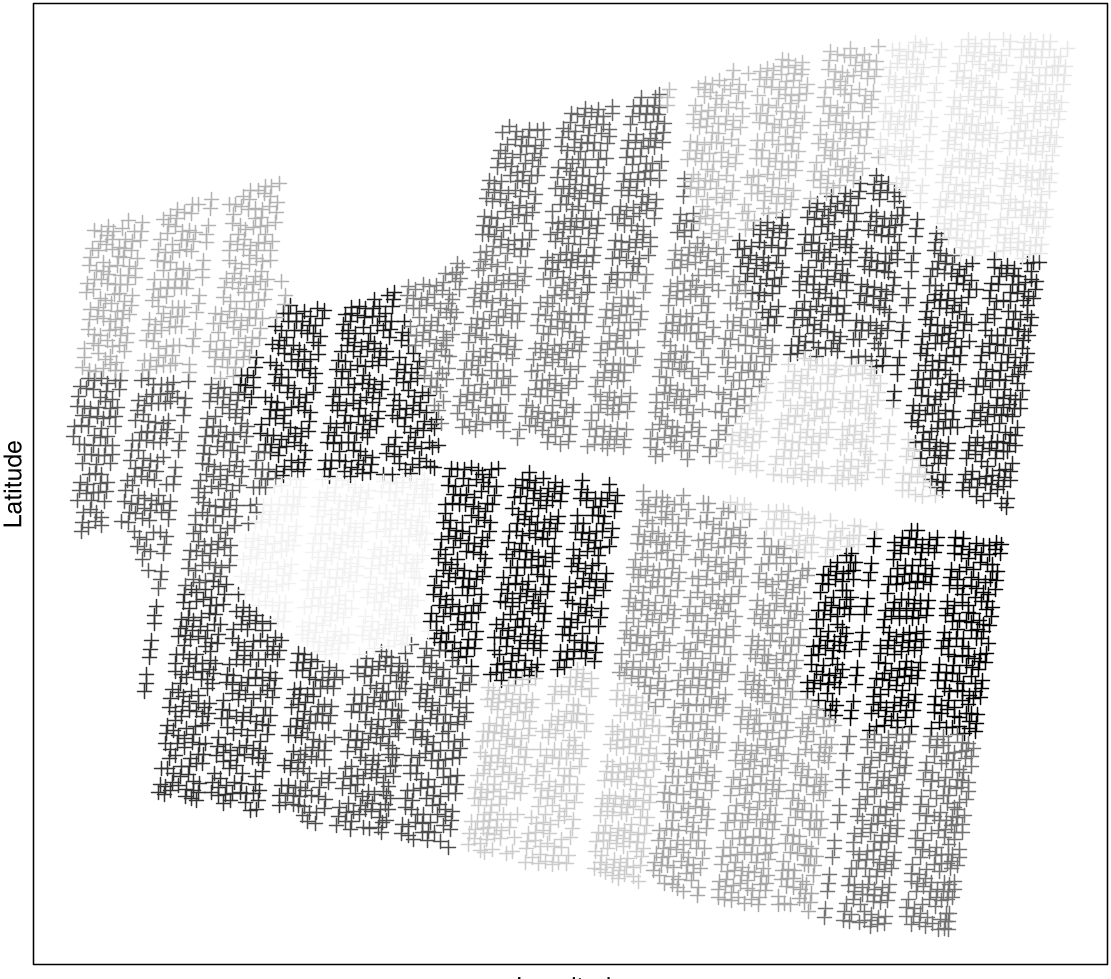 Figure: k-means clustering (k=20) used to partition the field into spatially disjoint training and testing sets.
2. The Spatial Fold
In a 10-fold spatial cross-validation, the model is trained on 9 clusters and tested on the 10th. This forces the model to predict yield for a portion of the field it has never "seen" geographically, neutralizing the unfair advantage provided by spatial proximity.
Models and Math: SVR vs. Random Forests
The paper benchmarks several heavy-hitters:
- Support Vector Regression (SVR): Minimizing empirical risk using the -insensitive loss function. It maps data into higher dimensions using kernels (RBF/Polynomial).
- Random Forests/Bagging: Ensemble methods that aggregate multiple regression trees.
The authors specifically look at Apparent Electric Conductivity (EC25) and Red Edge Inflection Point (REIP)—proxies for soil properties and chlorophyll content.
Experimental Showdown: The Reality Check
The results are a wake-up call for agricultural data scientists. Look at the divergence between "spatial" and "non-spatial" RMSE in the table below:
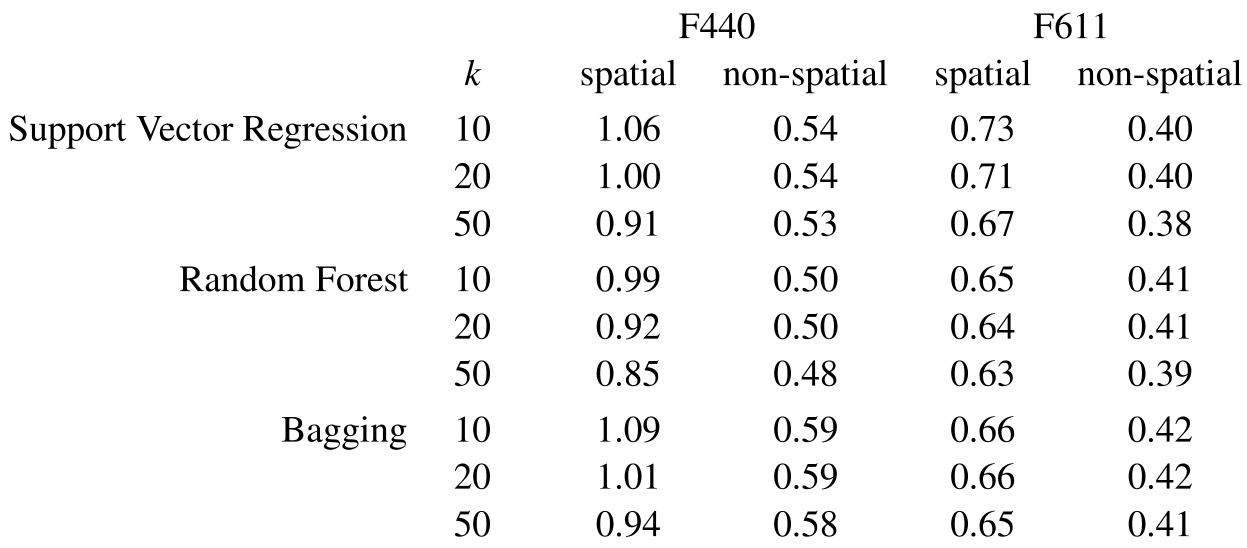
Key Insight: For Field F440, SVR reported an RMSE of 0.54 in the non-spatial setup. In the spatial setup, the error jumped to 1.06. This means that 50% of the perceived "accuracy" of the model was actually just a byproduct of spatial data leakage!
Critical Analysis & Conclusion
Takeaways
- Honesty Matters: Statistical independence is a luxury that spatial data does not afford. Clustering-based sampling is essential for valid SOTA comparisons.
- Random Forests Win: In a fair (spatial) fight, Ensemble methods like Random Forests outperformed SVR, likely due to their ability to handle the non-linear, high-dimensional noise of sensor data more robustly.
Limitations
- Boundary Effects: Even with clustering, samples at the very edge of two adjacent clusters might still exhibit some correlation.
- Hyperparameter Sensitivity: The choice of in k-means acts as a trade-off between statistical validity and data density.
Future Outlook
This work paves the way for "Management Zone" discovery. If we can accurately predict yield by treating the field as a collection of distinct zones, farmers can apply nitrogen fertilizer precisely where it’s needed, rather than blanketing the whole field—saving costs and the environment.