
Beyond Text: Learning Environmental Ontologies from Numerical Measurement Data
The Relevance of Measurement Data in Environmental Ontology Learning
The paper introduces a methodology for Environmental Ontology Learning that extracts threshold values for ontological rules from numerical measurement data. Using k-means clustering on European lake nutrient datasets, the authors learn specific parameters for "poorIn" and "richIn" nitrogen relations to improve rule-based reasoning in environmental software systems.
TL;DR
Most ontology learning is stuck in the world of NLP, but environmental science speaks the language of numbers. This paper presents a framework to learn ontological rules from numerical sensor data, specifically identifying nutrient thresholds for lakes. By combining k-means clustering with Semantic Web reasoning (Jena/SPARQL), the authors prove that concepts like "Nutrient Rich" are not universal—they are heavily dependent on where and when the data was collected.
Positioning in the Field
While typical ontology engineering relies on labor-intensive manual construction or text-mining, this work is a SOTA-bridge between Unsupervised Data Mining and Knowledge Representation. It positions numerical measurement as a primary citizen in the ontology learning lifecycle.
Motivation: The Context Gap in Formal Knowledge
Existing environmental ontologies often define relations like poorIn(lake, Nitrogen) using static thresholds. However, nature is not uniform. A nitrogen level considered "high" in the pristine lakes of Finland might be considered "low" or "average" in the industrial or agricultural landscapes of Spain.
The authors argue that if an ontology is to be useful for software systems, it must:
- Move beyond text: Learn from the actual physical measurements (numerical tuples).
- Embrace Context: Account for spatial (geographical) and temporal (time-based) shifts in data distribution.
Methodology: The Data Mining-Ontology Cycle
The core of this research is a cyclical interaction where the ontology guides the learning, and the learning updates the ontology.
1. Heuristic Guidance
The ontology defines that a lake's nutrient status is essentially binary (poorIn vs. richIn). The authors use this domain knowledge to set for a k-means clustering algorithm, avoiding the traditional "elbow method" or trial-and-error.
2. Threshold Extraction
Using total nitrogen concentration data from the European Environmental Agency (EEA):
- Step A: Run k-means to find two centroids ().
- Step B: Calculate the threshold .
- Step C: Inject into Jena rules:
totalNitrogen(?i, ?x) ∧ lessThanOrEqual(?x, ?y) → poorIn(?i, Nitrogen)
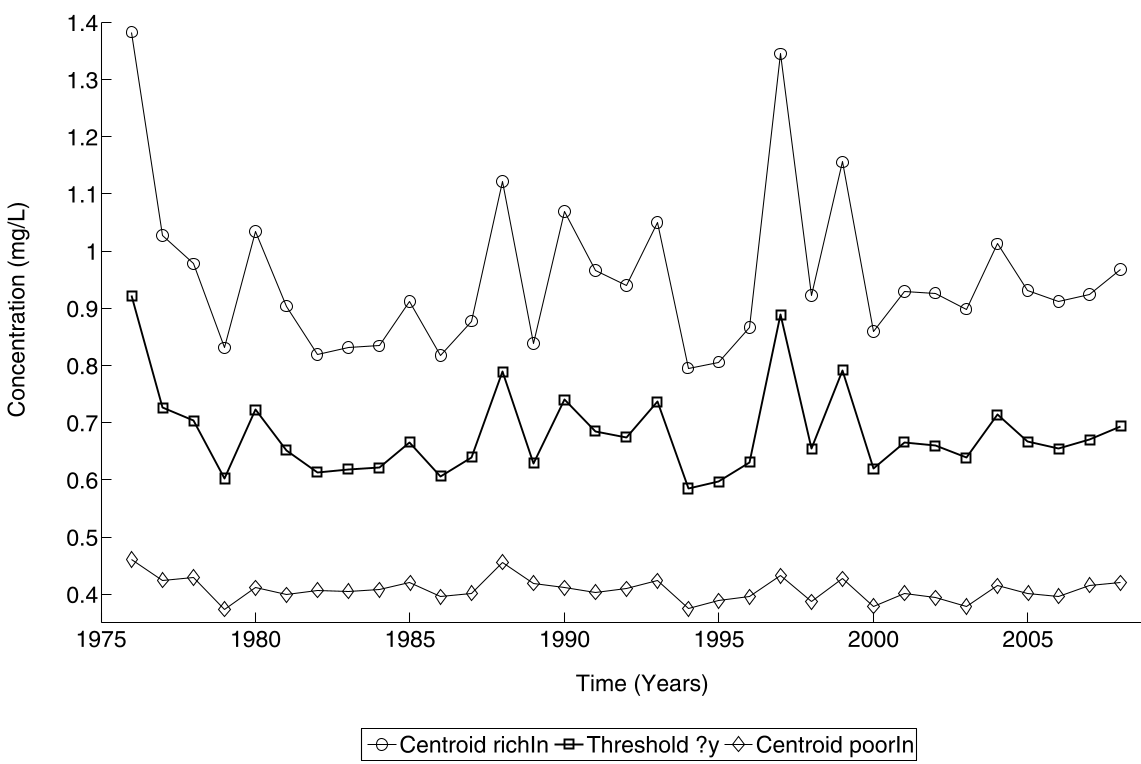 Figure 1: Comparison of nitrogen threshold variation over time for Finnish lakes (1976-2008).
Experiments: The Relativity of "Rich" and "Poor"
The authors analyzed 203 lake monitoring stations in Finland and 149 in Spain for the year 2008.
Spatial Variance (Across Countries)
| Country | poorIn Centroid | richIn Centroid | Learned Threshold () |
|---|---|---|---|
| Finland | 0.39 | 0.88 | 0.63 |
| Spain | 0.78 | 8.36 | 4.57 |
The data reveals a startling fact: A Spanish lake with a nitrogen level of 2.0 mg/L would be classified as "Rich" by Finnish standards () but "Poor" by Spanish standards (). A static, global ontology would be fundamentally wrong in one of these contexts.
Temporal Variance (Over Time)
In Finland alone, the "rich" centroid fluctuated from 0.41 to 0.95 over 33 years. This suggests that "Environmental Truth" is a moving target, requiring automated systems to periodically re-learn their ontological axioms.
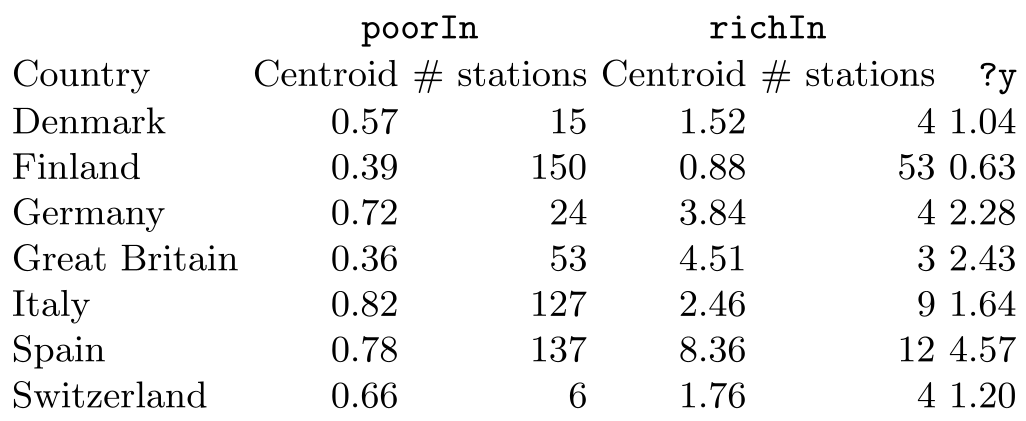 Table 1: Nutrient status centroids and thresholds across various European nations.
Critical Analysis & Takeaways
Why this works
By using k-means centroids, the authors provide a statistically grounded way to define "qualitative" terms (rich/poor) using "quantitative" data. This bridges the gap between low-level sensor observations and high-level semantic reasoning.
Constraints & Future Work
- Univariate Limitation: Currently, the model only looks at one variable (Nitrogen). Environmental status is often multivariate (Phosphorus, Humus, Chlorophyll).
- Simple Thresholding: Using a simple mean between centroids might not be the most robust method in skewed distributions.
- Integration: The authors suggest future work will include an "Ontology of Learning Tasks" to automate the selection of data sources and mining algorithms.
Bottom Line
This paper is a call to action for the Semantic Web community: Stop looking only at Wikipedia and start looking at the sensors. To build truly "smart" environmental systems, our ontologies needs to be as dynamic as the ecosystems they represent.