
SSM System: Bridging the Gap Between Walking and Buying in Retail
Sales Strategy Mining System with Visualization of Action History
The paper introduces the Sales Strategy Mining (SSM) system, a decision-support tool that integrates Point of Sale (POS) data with Radio Frequency Identification (RFID)-tracked customer moving histories. The system utilizes an interactive visualization interface to help store managers derive actionable sales strategies beyond simple purchase patterns.
TL;DR
Data mining in retail is often limited to POS (Point of Sale) data—knowing what left the shelf. The Sales Strategy Mining (SSM) system changes the game by integrating RFID-tracked moving histories. By visualizing where customers go versus where they spend, the system empowers managers to move beyond "discount-heavy" tactics toward sophisticated, layout-driven sales strategies.
The "Missing Link" in Retail Analytics
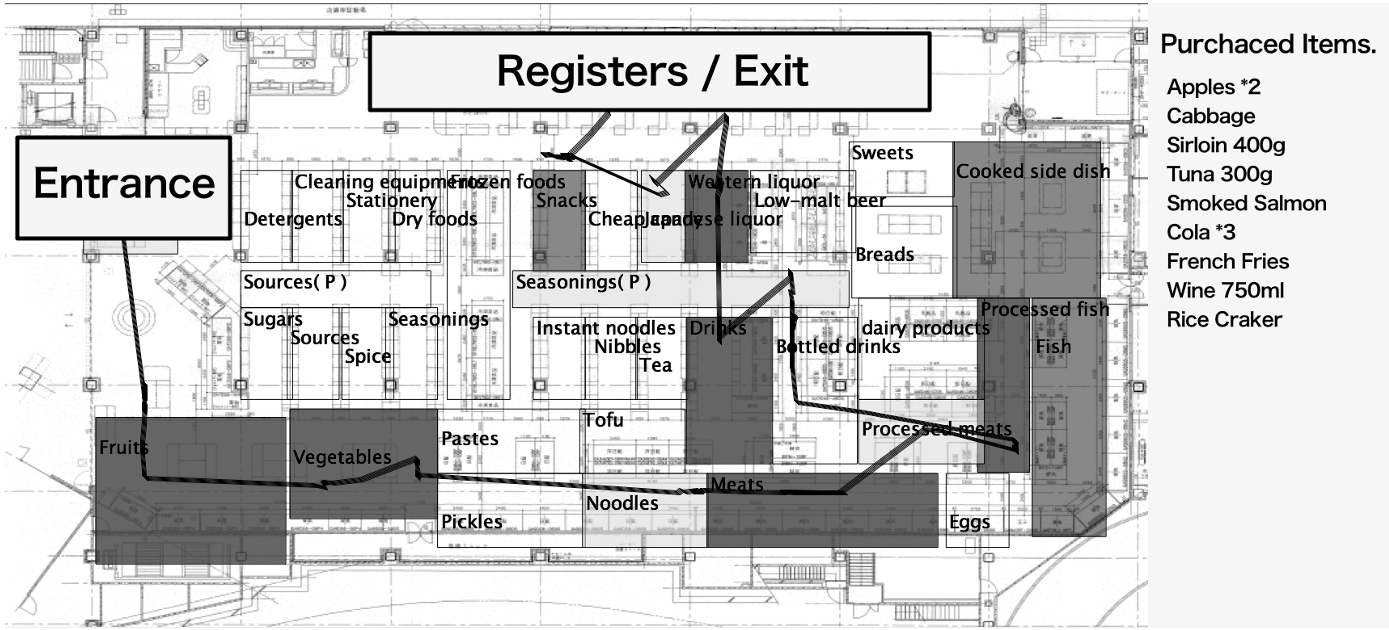
For decades, retailers have been obsessed with POS data. However, POS is an "outcome" metric. It doesn’t tell you if a customer spent 10 minutes staring at the meat aisle before walking away, or if they missed the snack section entirely because of a bottleneck.
The core motivation of this research is that moving history is the bridge to human intent. The authors argue that objective POS data must be combined with subjective human interpretation of movement patterns to generate truly innovative strategies.
Methodology: The 5-Step Strategy Framework
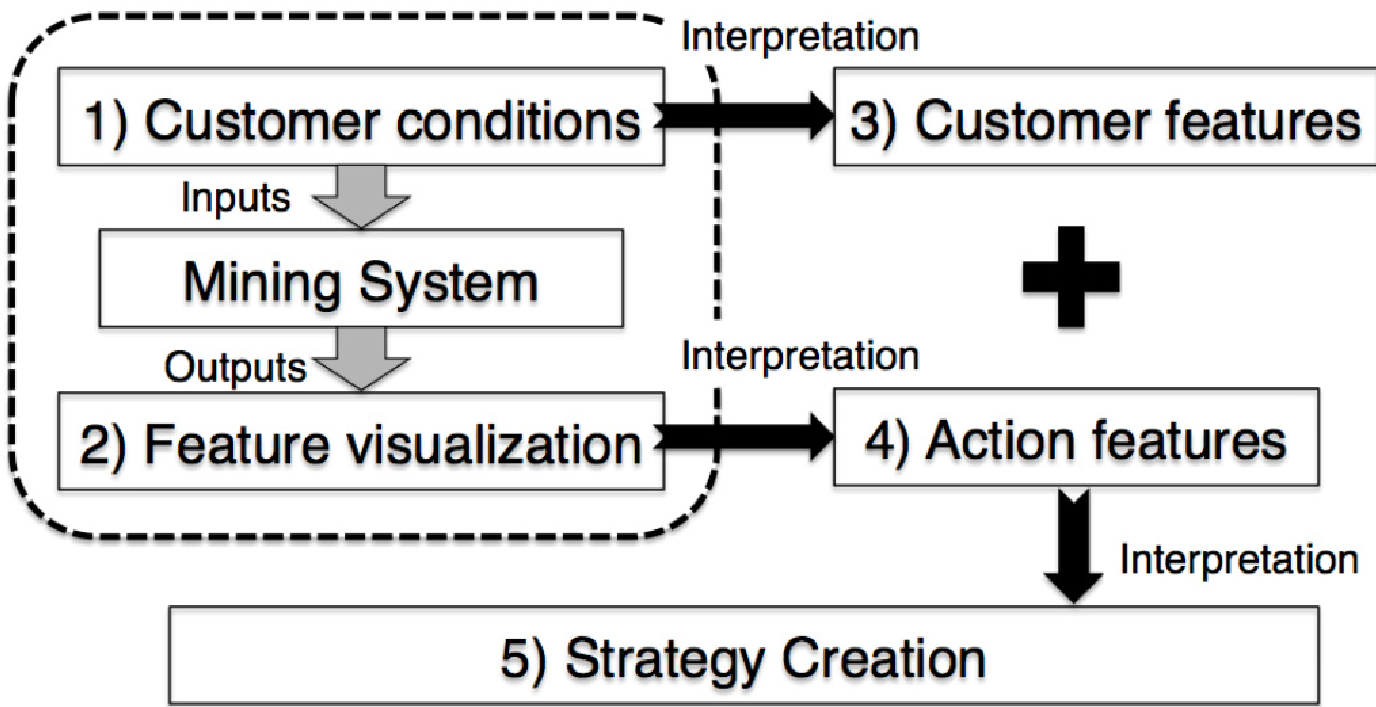
The SSM system isn't just a dashboard; it's a workflow. The authors define a structured pipeline to turn raw coordinates and receipts into business logic:
- Input & Shrink: Filter data by time, gender, or total spend.
- Feature Extraction: The system identifies the "Best 3" and "Worst 3" areas based on movement.
- Customer Persona: The user defines who these people are (e.g., "Housewives shopping for dinner").
- Action Interpretation: The user analyzes the heatmaps (e.g., "They pass the liquor but don't buy").
- Strategy Synthesis: Combining the persona and the action into a fix (e.g., "Place snacks near the liquor to trigger impulse buys").
The Differential Map: Visualizing the "Why"
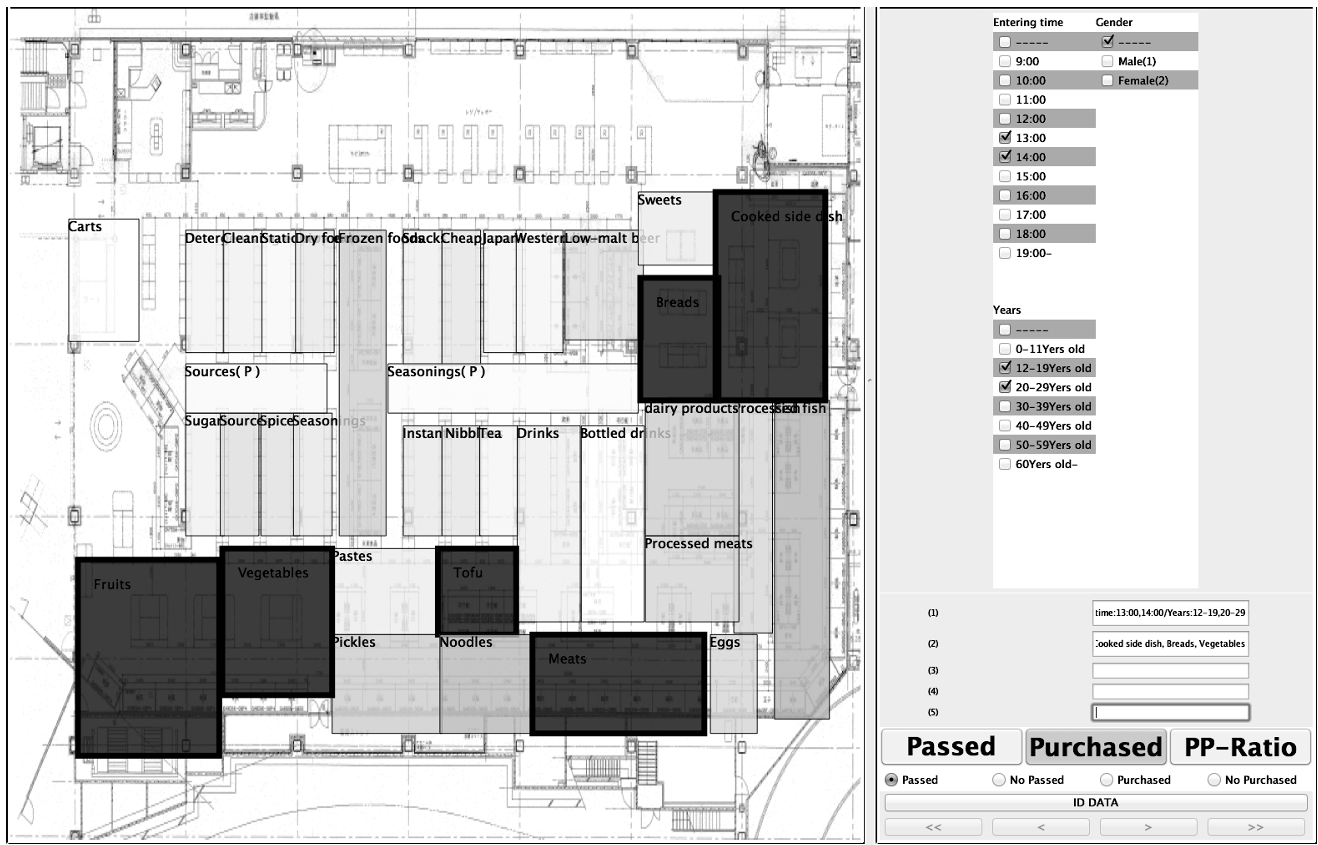
The system's "secret sauce" is the Differential Map. Instead of showing raw traffic, it calculates the difference between the specific filtered group and the average customer. Areas colored in Red indicate higher-than-average activity for that segment, allowing for instant visual identification of niche behaviors.
Experimental Evidence: Quality Over Quantity
The researchers conducted a head-to-head trial between the full SSM system and a POS-only version.
- The Quantitative Trap: Interestingly, POS-only users created more strategies. Why? Because looking at simple sales dips is easy—just suggest a "Price Down."
- The Qualitative Edge: Users with access to moving history proposed radically different solutions. Instead of lowering prices, they suggested layout changes (80% of users) and cross-merchandising based on traffic flow.
Critical Insight & Future Outlook
The most striking takeaway is the PP-Ratio (Purchased/Passed). This metric identifies "Dead Zones"—areas where people walk but don't buy. This is a goldmine for retailers. If a high-traffic area has a low PP-Ratio, the problem isn't the foot traffic; it's the product display or the pricing in that specific zone.
Limitations: The study used students rather than professional store managers, and the tracking was limited to RFID carts (not accounting for customers without carts).
Future Directions: As we move toward the era of "Smart Retail," integrating this logic with real-time AI agents could allow stores to dynamically change digital signage and promotions based on the live "PP-Ratio" of the morning's shoppers.
Conclusion
The Sales Strategy Mining system proves that spatial context is the soul of retail data. By forcing users to interpret "Action Features" alongside "Customer Features," the system transforms data mining from a passive reporting tool into an active engine for store innovation.