
SOM-Based Fraud Detection: Unmasking Illegal Fuel Smuggling in Bolivia
Self-organizing maps for anomaly detection in fuel consumption. Case study: Illegal fuel storage in Bolivia
This paper introduces an unsupervised anomaly detection framework using Self-Organizing Maps (SOM) to identify illegal fuel storage and smuggling in Bolivia. The system leverages RFID data from the "B-SISA" database and classifies fueling behaviors into "Local" (individual history) and "Global" (peer context) anomalies, achieving an 81% detection accuracy.
TL;DR
To combat massive fuel smuggling driven by national subsidies, researchers have developed an unsupervised AI framework using Self-Organizing Maps (SOM). By analyzing RFID fueling records at both an individual (Local) and group (Global) level, the system identifies suspicious patterns—such as high-volume purchases in short intervals—with 81% accuracy, providing a scalable solution for real-time monitoring of over 1.4 million vehicles.
Problem & Motivation: The Subsidy Loophole
In Bolivia, the government subsidies nearly 50% of fuel costs. This economic policy creates an incentive for "fuel accumulators" who purchase large quantities illegally to sell them across borders. While the National Hydrocarbons Agency (ANH) uses RFID tags to log every transaction in the "B-SISA" database, the sheer volume of data makes manual oversight impossible.
The technical challenge lies in definition and labeling:
- Fuzzy Boundaries: What is "normal" for a long-haul truck is "anomalous" for a motorcycle.
- Lack of Labels: There are no pre-labeled "fraud" datasets, making supervised learning (like SVM) impractical.
- Context Shift: A sudden increase in fuel might be a legitimate road trip or a fraudulent storage event.
Methodology: Local vs. Global Insights
The core of the proposal is the distinction between two types of anomalies:
- Local Anomaly: Deviation from the vehicle's own historical behavior.
- Global Anomaly: Deviation from a peer group (e.g., other urban vans or rural trucks).
The Knowledge Representation
Before feeding data into the SOM, the researchers transform raw logs into a specialized feature vector:
- Amount (): Normalized fuel volume.
- Interval (): Normalized time between refueling events.
- Sliding Window (): They look at three consecutive records to find "sequences" of suspicion.
Why SOM?
Self-Organizing Maps (Kohonen Networks) are perfect for this because they map high-dimensional data onto a 2D grid (topology) while preserving the relative distances between data points.
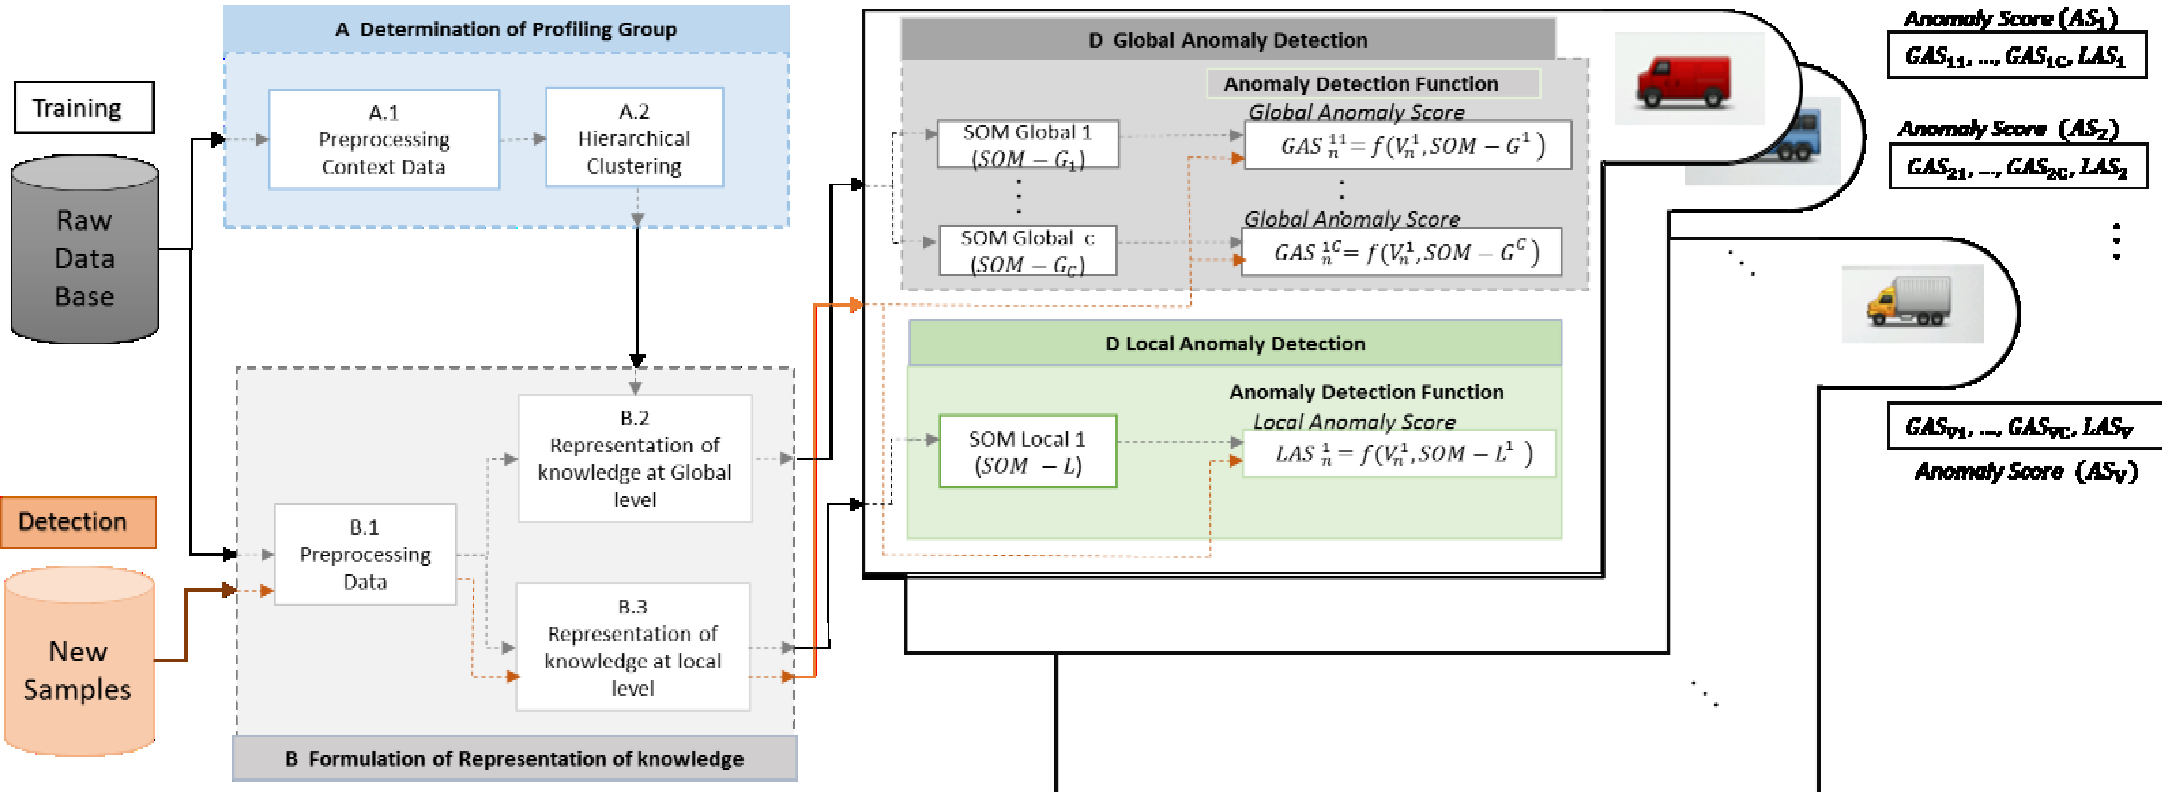 The four-step process: Profiling, Knowledge Representation, and Dual-level Anomaly Detection.
Experiments & Results
The study analyzed 1,000 vehicles with nearly 200,000 records. Using a hexagonal SOM lattice (ranging from 10x10 to 100x100 depending on data density), the authors identified "clusters of abnormality."
Key Findings:
- Detection Certainty: 81% overall accuracy compared to human-labeled validation sets.
- Recall: 75% of true local anomalies were caught; 81% of global anomalies were correctly flagged.
- Visual Evidence: The SOM maps (see below) show clear "red zones" where weight vectors represent the dreaded "High Amount + Short Interval" pattern.
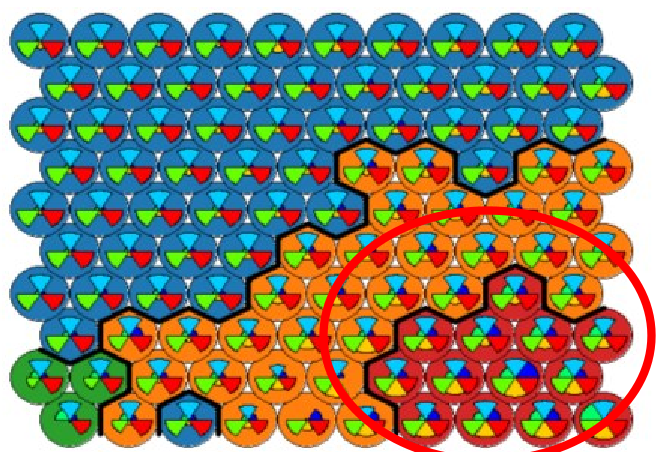 Fig 5: The SOM grid where red circles indicate neurons representing anomalous behavioral prototypes.
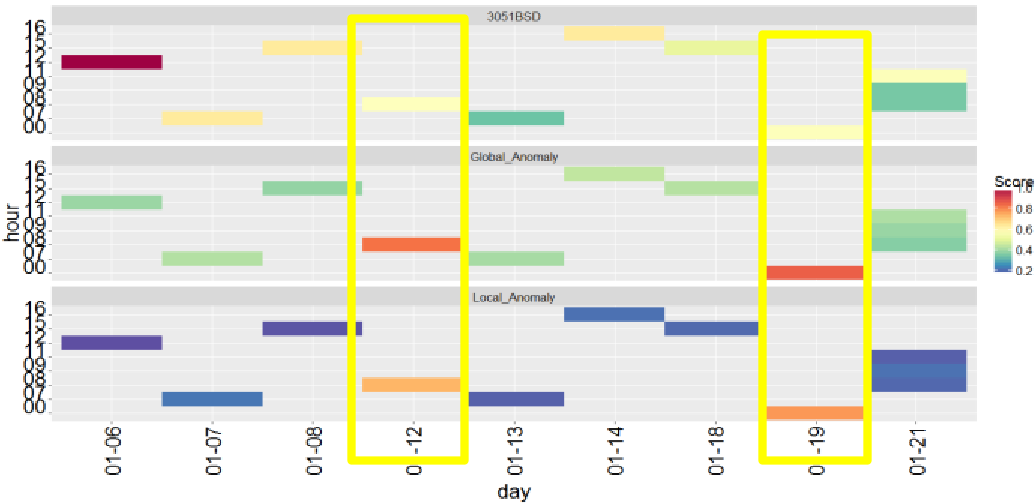 Fig 8: Time-series analysis showing high anomaly scores (red/yellow) aligning with suspicious fueling spikes.
Critical Analysis & Conclusion
Takeaway
The beauty of this research is its inductive bias: it assumes that fraud is not just a single data point, but a temporal pattern. By using SOM, the model "learns" the manifold of normal behavior and highlights the outliers without ever being told what a "thief" looks like.
Limitations & Future Work
- Dynamic Adaptation: Currently, the model is trained on 2015 data and tested on 2016. In a real-world setting, fueling habits evolve (e.g., economic shifts), requiring an online or streaming SOM that updates its weights in real-time.
- Feature Depth: Adding geographic data (GPS coordinates of gas stations) could further refine "Global Anomalies" by identifying high-risk border zones.
In conclusion, this case study proves that unsupervised neural networks can provide immediate socio-economic value in public policy enforcement, turning "passive" data collection into "active" intelligence.