
Beyond Buzz: Decoding Political Sentiment with Multiple Aggregate Functions
Sentiment Aggregate Functions for Political Opinion Polling using Microblog Streams
This paper introduces a comprehensive framework for political opinion polling using microblog streams by evaluating a diverse set of 24 sentiment aggregate functions. Using a dataset of 233,000 Portuguese tweets during the 2011-2014 bailout, the study demonstrates that combining these aggregators as features in a Random Forest regression model can effectively estimate official poll results.
TL;DR
Researchers from the University of Porto have developed a methodology to bridge the gap between "Twitter noise" and "Official Polls." By moving away from simple popularity metrics (Buzz) and instead utilizing a massive ensemble of 24 different sentiment aggregate functions, they achieved a high-precision estimation of Portuguese political trends with an error margin as low as 0.63%.
Background: The Polling Crisis
Traditional polling is in trouble. High costs and low participation rates are driving political scientists toward Social Media. However, the transition isn't simple. Is a "mention" a vote of confidence or a digital protest? To answer this, we need Sentiment Aggregate Functions—mathematical formulas that convert thousands of individual positive, negative, and neutral tweets into a single representative value for a given time period.
The "Portuguese Bailout" Case Study
The study analyzed the Portuguese political landscape during the 2011-2014 bailout—a period of intense austerity and high negativity.
- Dataset: 232,979 tweets categorized by polarity.
- Target: Official monthly polls for the 5 main political parties (PSD, PS, CDS, PCP, BE).
- Observation: Negative sentiment dominated (often >90% of mentions), making simple positive/negative ratios difficult to interpret without sophisticated aggregation.
Methodology: The Power of Multi-Feature Regression
Instead of searching for a "Holy Grail" sentiment index, the authors treated the 24 different aggregate functions as features in a Random Forest (RF) and Ordinary Least Squares (OLS) regression model.
1. The Pipeline
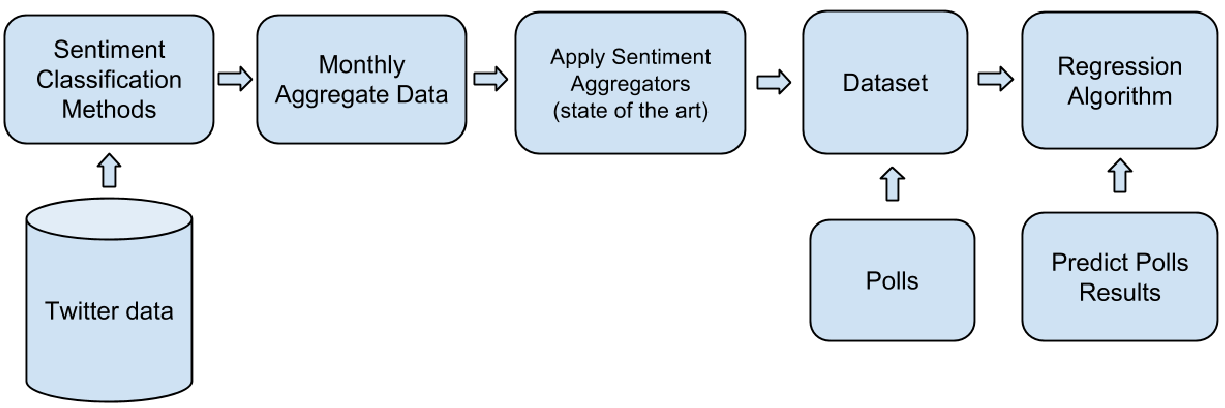
The system extracts entities (politicians), classifies sentiment, aggregates the counts monthly, and feeds them into a sliding-window training model.
2. Diverse Aggregators
The study implemented classic functions like:
- Connor's Ratio: Positives / Negatives.
- Bermingham's Log-Ratio: .
- Polarity over Total: .
Experimental Insights
The research highlights a critical distinction between predicting absolute poll numbers vs. monthly variations.
- Absolute Accuracy: The Random Forest model achieved a 3.1% MAE.
- Variation Accuracy: By predicting the change () in polls, the error dropped to 0.63%. This is vital because public opinion usually shifts incrementally rather than radically.
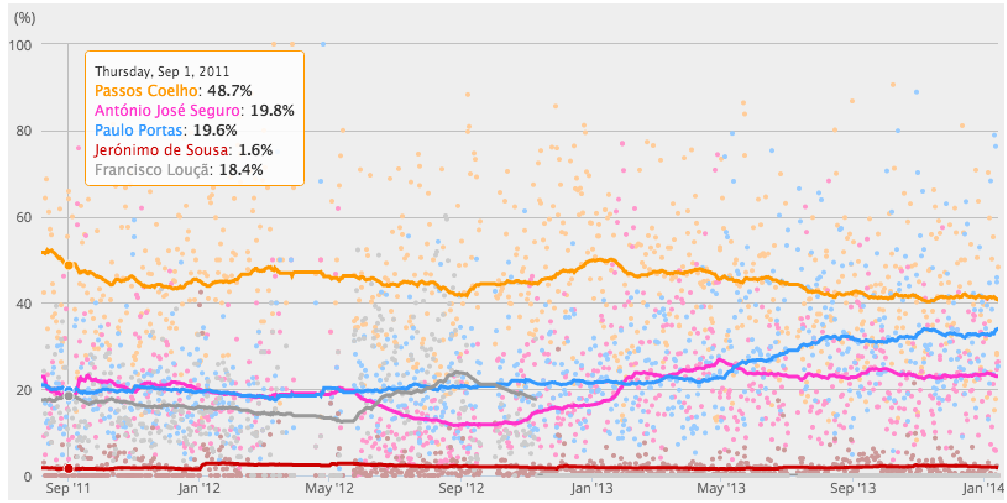
Above: The 'Negatives Share' function shows the PM (Passos Coelho) consistently receiving the most criticism, aligning with the "incumbent disadvantage" during austerity.
Feature Importance: What Really Matters?
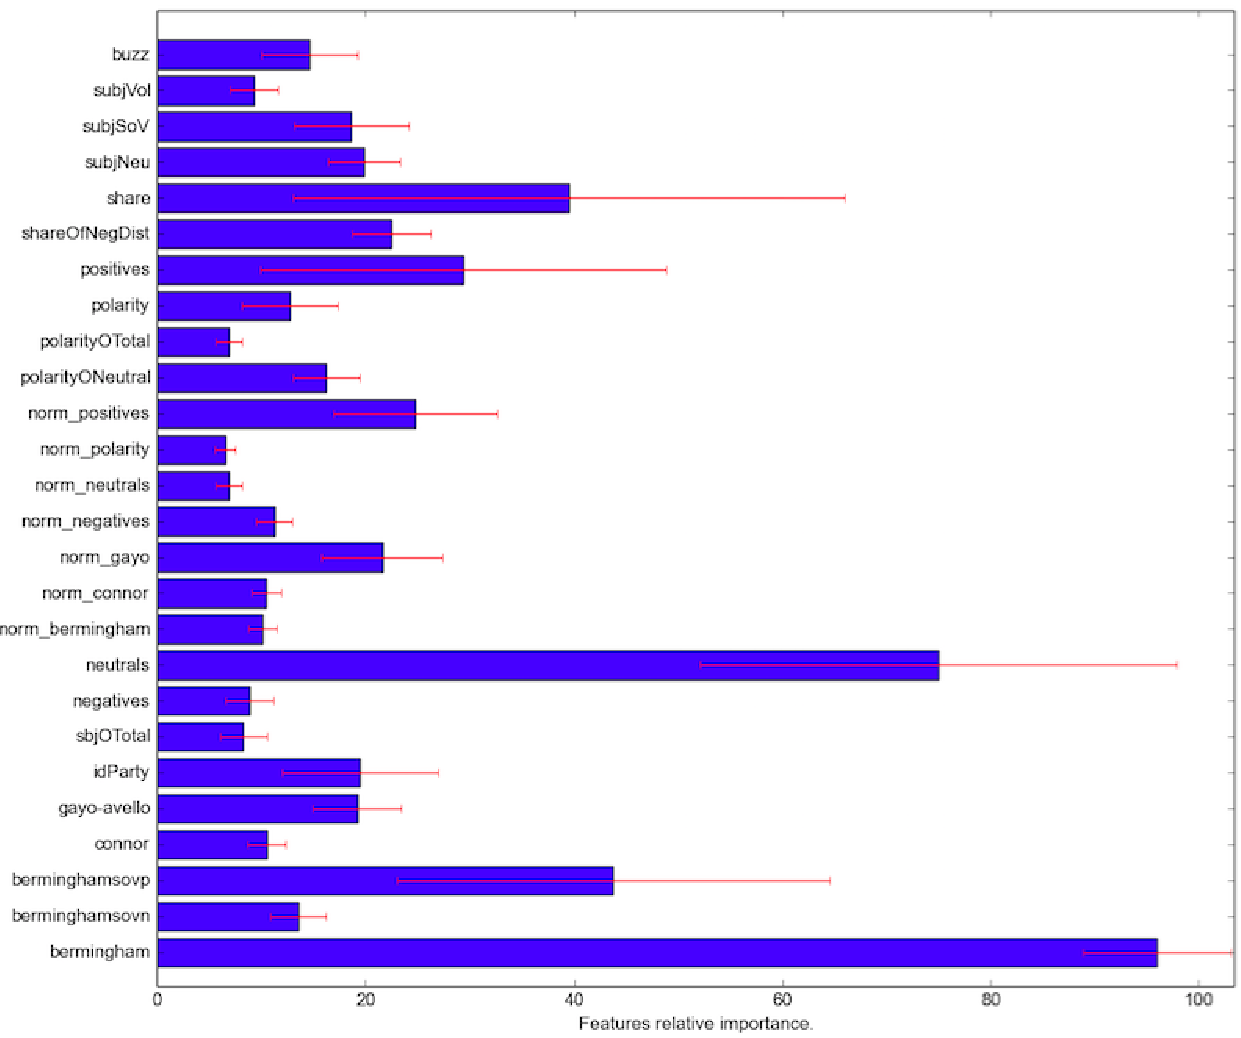
By using the Gini Importance metric, the authors found that the Bermingham function and the count of neutral mentions were the most informative. Interestingly, "Buzz" (total volume) lost its predictive dominance when sophisticated sentiment features were present.
Critical Analysis & Takeaways
The core insight of this work is Inductive Bias through feature variety. No single formula captures the complexity of a nation’s mood. However, by providing a non-linear model (Random Forest) with multiple "different views" of the data (the 24 functions), the model can learn which aggregator is most relevant for a specific party or a specific time of crisis.
Limitations
- Selection Bias: Twitter users are not a representative sample of the total electorate (usually younger, more urban).
- Sarcasm: The paper relies on a classifier with 80% accuracy, potentially struggling with the heavy irony used in political discourse.
Future Outlook
This work sets a strong baseline for moving beyond "Volume" to "Value." Future research should integrate Time Series Analysis (ARIMA/LSTM) and leverage modern LLMs to better understand the nuances of political rhetoric that simple sentiment labels might miss.