
Deciphering Hate: A Data Science Lens on Digital Violence Against Women in Monterrey
A Sentiment Analysis and Unsupervised Learning Approach to Digital Violence Against Women: Monterrey Case
This paper presents a data science framework specifically targeting Digital Violence Against Women (DVAW) in Monterrey, Mexico, using Sentiment Analysis and Unsupervised Clustering. By leveraging spaCy's CNN for hate speech detection and K-Means for structural grouping, the authors successfully identified violent discourse patterns within a dataset of over 2 million Spanish-language tweets.
TL;DR
This study tackles the growing crisis of Digital Violence Against Women (DVAW) by analyzing over 2 million tweets from Monterrey, Mexico. Using a mix of CNN-powered Sentiment Analysis and K-Means clustering, the researchers identified that nearly 20% of local discourse contains elements of digital violence, cataloging these behaviors into distinct clusters based on how they spread and who they target.
Context: When the Digital Space Becomes a Battlefield
In Mexico, violence against women has historically permeated physical spaces, but it has now migrated into the digital realm. The challenge for researchers isn't just "detecting" a bad word; it is understanding the symbolic expressions of violence—threats, insults, and hate messages—that maintain structural inequality. This paper moves the needle from simple cyberbullying detection toward a specialized analysis of gendered digital aggression.
The Methodology: From Sentiments to Structures
The researchers didn't just look for keywords; they built a pipeline to understand the "why" and "how" of violent tweets.
1. Sentiment Filtering
Using the spaCy library, the team implemented a Convolutional Neural Network (CNN) trained on the Hateval 2019 competition dataset. This model acts as a sieve, separating objective factual sentences from subjective, hate-filled discourse specifically targeting women.
2. Dimensionality Reduction & Clustering
Raw tweet data is messy. To make sense of 410,000+ violent tweets, the authors used Principal Component Analysis (PCA) to condense 8 variables (like retweet count, favorite count, and mentions) into two manageable components.
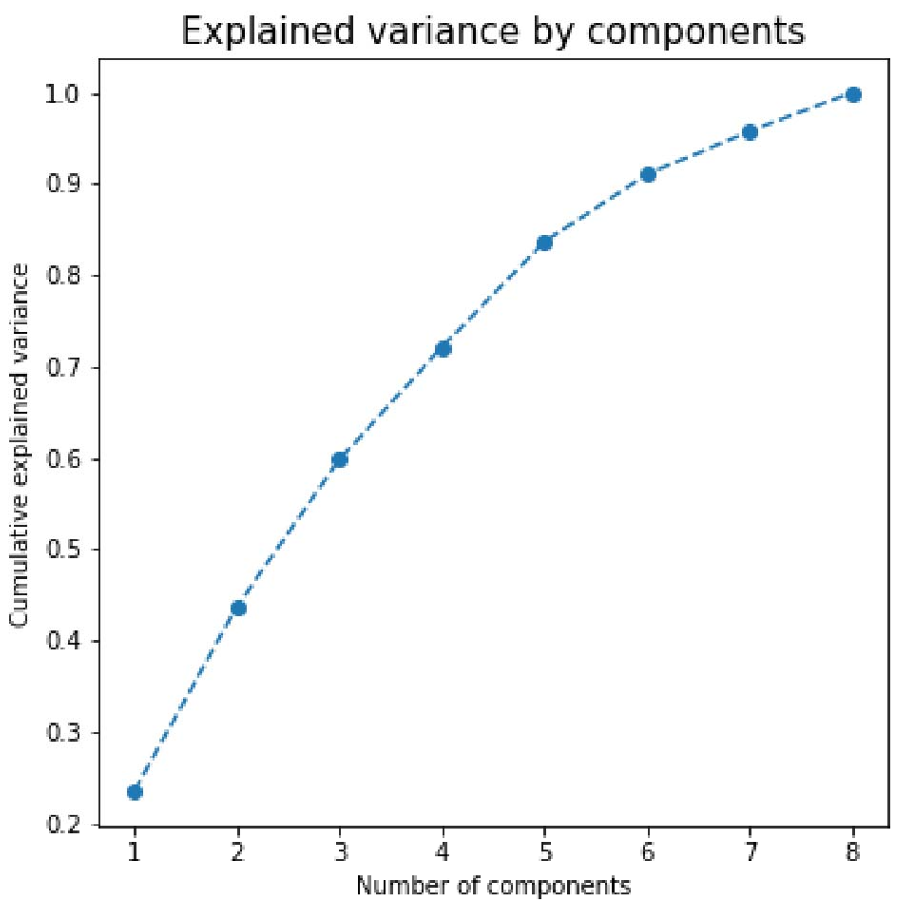 Figure: 2D-visualization showing how features like 'Retweet Count' and 'User Mentions' define the axes of digital violence.
Key Insights: Navigating the 8 Clusters
The core contribution of this work lies in its Unsupervised Learning results. By applying K-Means (with ), the study revealed two primary "axes" of digital violence:
- The Viral Axis (PC2): Driven by
Favorite CountandRetweet Count. These represent "Popular Impersonal" violence—misogynistic content intended for a wide audience rather than a specific individual. - The Personal Axis (PC1): Defined by
Is Reply,User Mentions, andLength of Text. This represents "Unpopular Personal" harassment—direct attacks, often more verbose, aimed at specific victims.
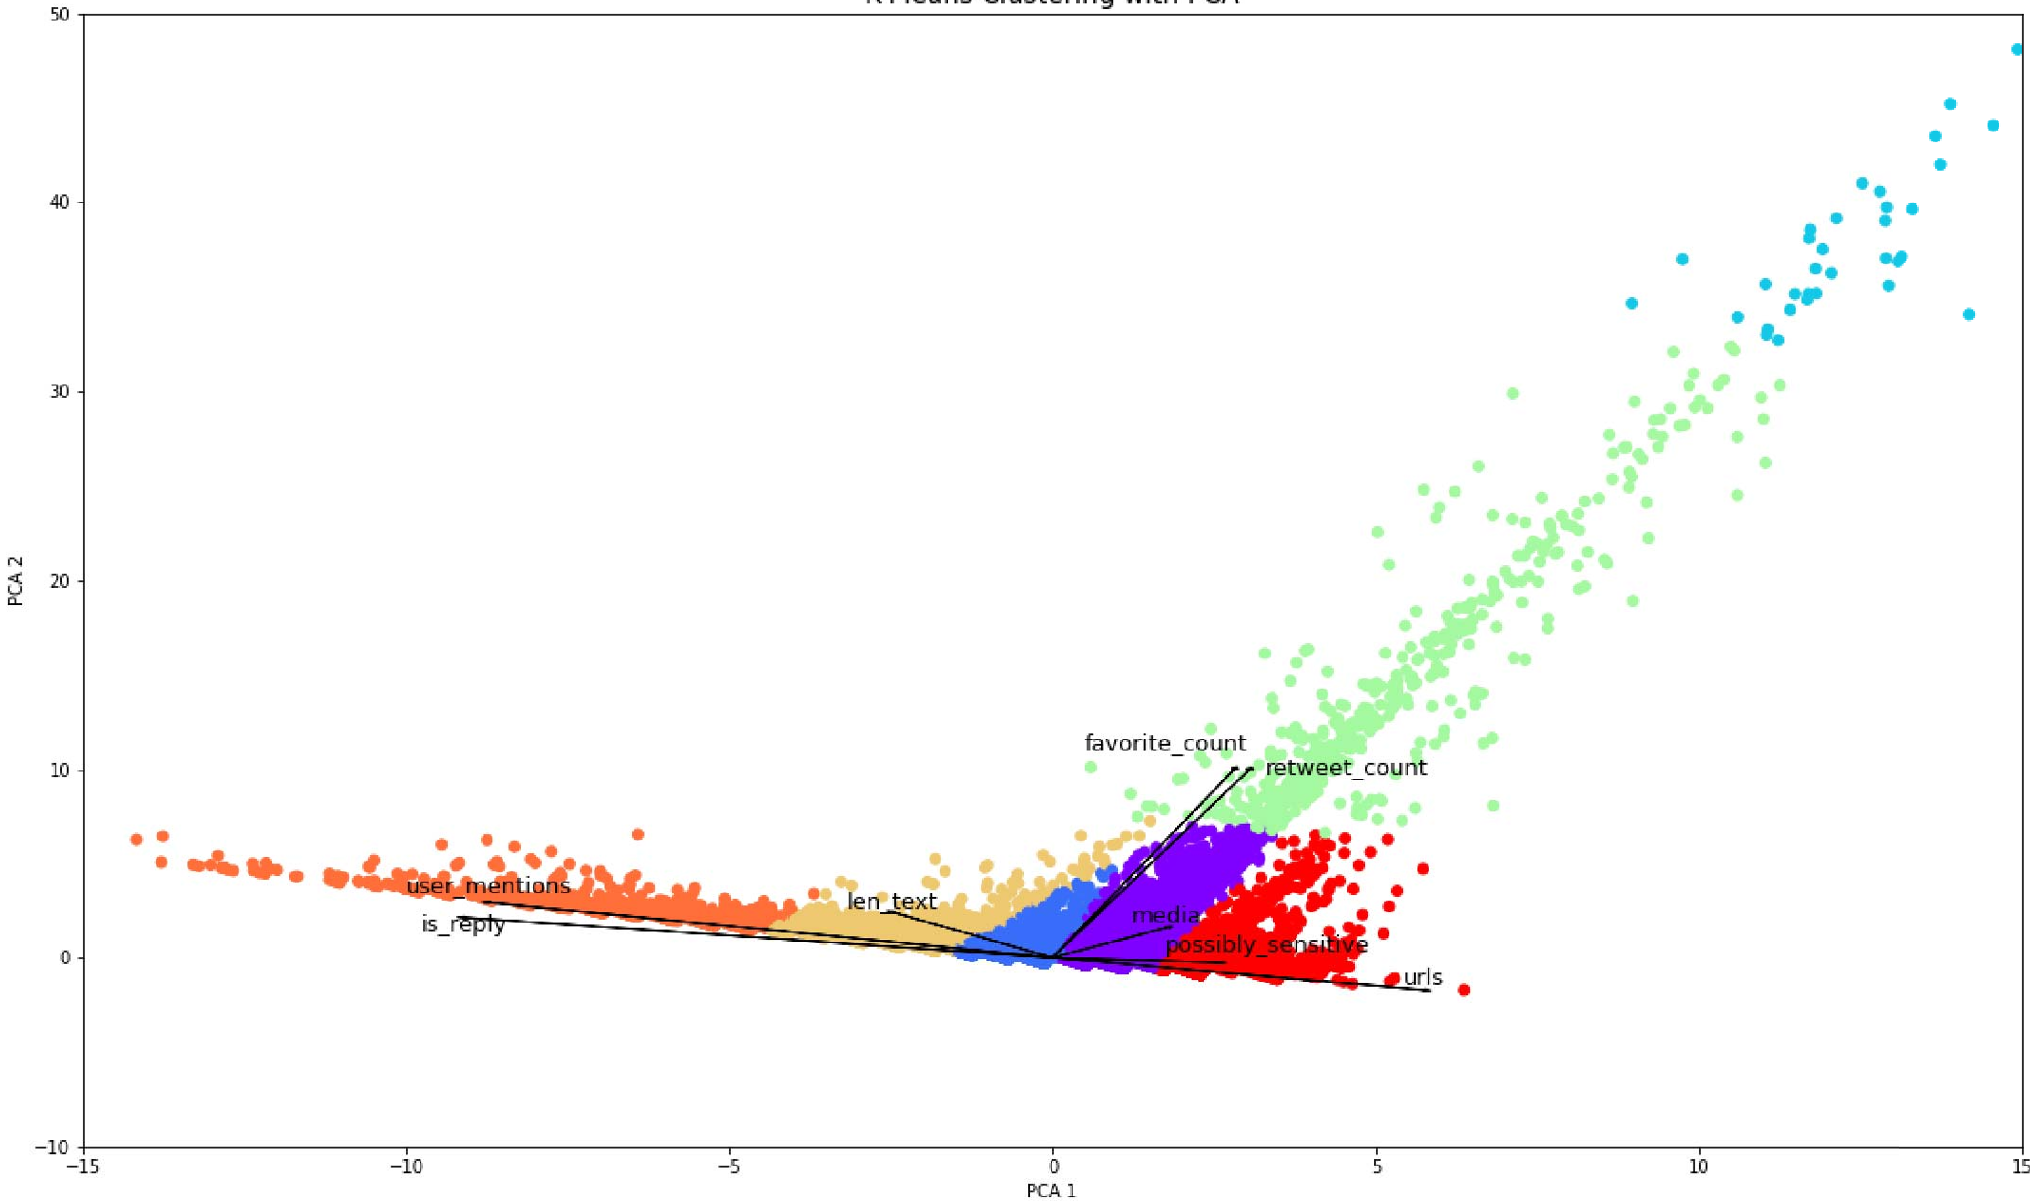 Figure: Zoomed-in view of the 8 clusters. Note how different attack styles (Media-heavy vs. Reply-heavy) occupy distinct regions in the latent space.
Experimental Performance
The neural network achieved an accuracy of 76.4% on secondary datasets (Kaggle). While the authors admit this should ideally reach >90% for production-grade monitoring, the current results provided a sufficient foundation to uncover the 19.8% prevalence rate of DVAW in the Monterrey dataset.
Deep Insight: Why This Matters
The most striking takeaway is the geographical specificity. By isolating Monterrey, the study highlights how local slang and social dynamics influence the "shape" of digital violence. The differentiation between "anonymous viral hate" and "direct targeted harassment" is crucial for social platforms and legal authorities to design better intervention strategies.
Future Outlook & Limitations
- Accuracy Gap: The current 76% accuracy suggests that "nuance" (like irony or specific Mexican slang) is still hard for basic CNNs to catch. Future work incorporating Transformers (like BERT or RoBERTa) and profanity-specific embeddings is necessary.
- The 44% Variance: The two main PCA components only captured 44% of the data's variance. Moving to 3D clusters or higher-dimensional analysis might reveal even more "types" of digital aggressors.
Conclusion
This research provides a vital blueprint for using Unsupervised Learning to map social crises. It proves that digital violence isn't a monolith; it has distinct patterns that can be mathematically identified, clustered, and ultimately, countered.