
Beyond the Boundary: Shape Indexing via 2-D Regional Analysis
Shape Indexing and Recognition Based on Regional Analysis
This paper introduces a novel shape indexing and recognition framework based on 2-D regional analysis rather than traditional 1-D contour-based methods. The core method partitions shapes into 12 component regions (halves and quadrants) and extracts a 63-dimensional feature vector, achieving competitive performance on the MPEG-7 CE-Shape-1 dataset while maintaining high computational efficiency.
TL;DR
Most AI models "see" shapes as thin lines (contours), yet humans perceive them as solid blocks of space. This paper proposes a 2-D regional analysis framework that abandons boundary tracking in favor of area partitioning. By breaking a shape into 12 quadrants and halves and describing their geometry with just 63 numbers, the author achieves SOTA-level indexing speed and accuracy.
Perspective Shift: Human Vision vs. Small Bugs
Existing methods like Curvature Scale Space (CSS) treat a shape as an "intrinsic curve." As the author eloquently puts it, this is how a "small bug crawling along a wire" would perceive the world, not a human. The Human Vision System (HVS) is a top-down processor that prioritizes global geometry and the organization of parts.
The motivation here is twofold:
- HVS Alignment: Treating shapes as 2-D planar regions.
- Efficiency: Creating a "Shape Index" that can be searched as quickly as a numerical database, avoiding the "marriage problem" (intensive point-to-point matching).
Methodology: The Anatomy of a Shape Index
The framework relies on a systematic decomposition of the 2-D space occupied by the shape.
1. Global Orientation (Eigen-Analysis)
Before measurement, the shape must be "straightened." The author uses Principal Component Analysis (PCA) to find the major and minor axes of the shape. By aligning these axes to a standard coordinate system, the index becomes invariant to rotation.
2. Recursive Partitioning
Once aligned, the shape is sliced into:
- Four Halves: Based on the major and minor axes.
- Eight Quadrants: Standard quadrants plus diagonal-centered slices.
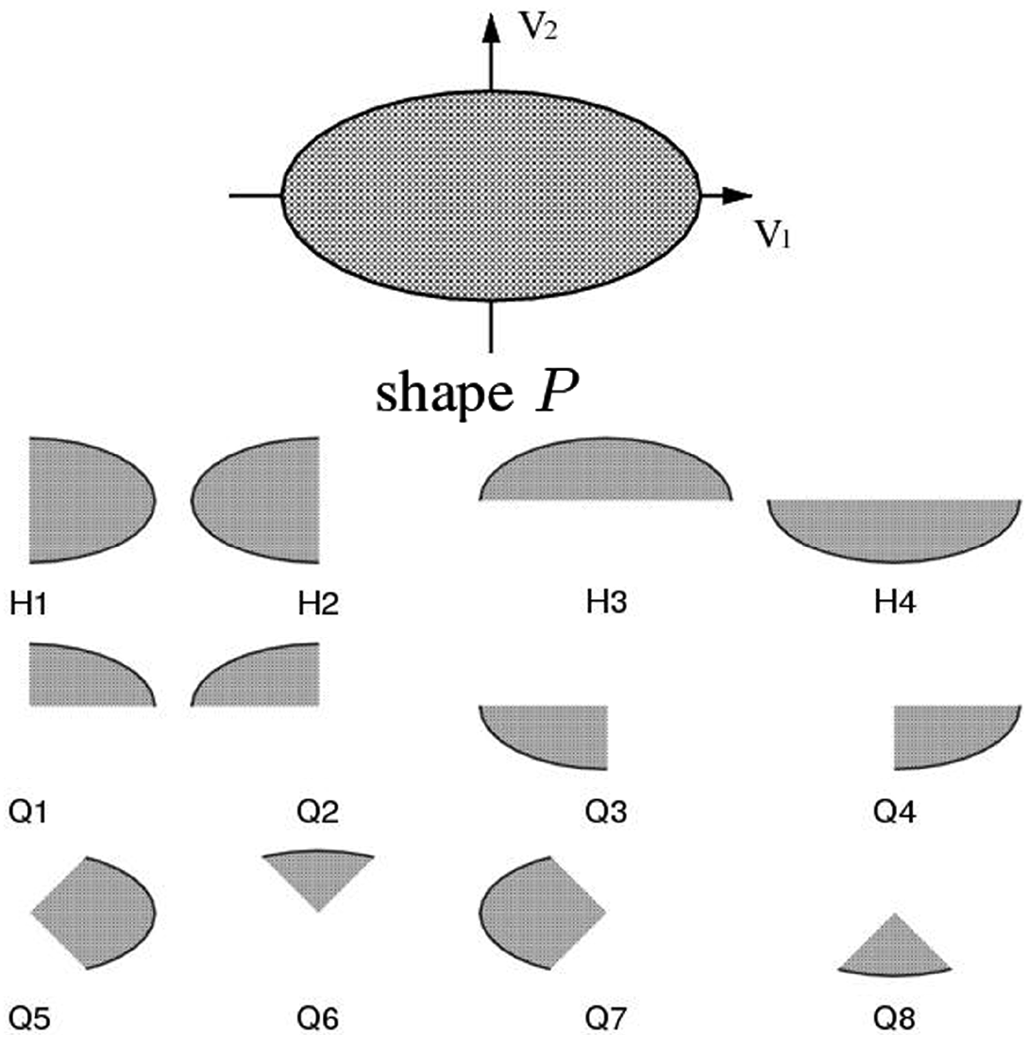 Figure 1: The partitioning of an oval shape into its component halves and quadrants.
3. The 63-Dimension Feature Vector
For every region (including the whole shape), five key metrics are calculated:
- Aspect Ratio (): Measures elongation.
- Compactness Ratio (): Relates boundary length to area.
- Geometrical Compactness (): A novel metric that weights boundary points by their neighbor count (convex vs. concave), capturing local "texture" within a global metric.
- Compositional Ratios: How much of the total shape's area and boundary belong to this specific sub-region.
Experimental Battleground: MPEG-7 and Beyond
The author tested the system against the most rigorous benchmarks of the era, including the MPEG-7 CE-Shape-1 dataset, which consists of 1,400 diverse silhouettes.
SOTA Comparison
In terms of the Bullseye Score (a standard retrieval accuracy metric), the regional analysis approach holds its own against far more complex algorithms:
| Method | Bullseye Score | Complexity |
|---|---|---|
| CSS (Mokhtarian) | 75.44% | Medium |
| Regional Analysis (Ours) | 75.97% | Low (Linear) |
| Shape Context | 76.51% | High |
| Shock Edit Distance | 78.17% | Very High |
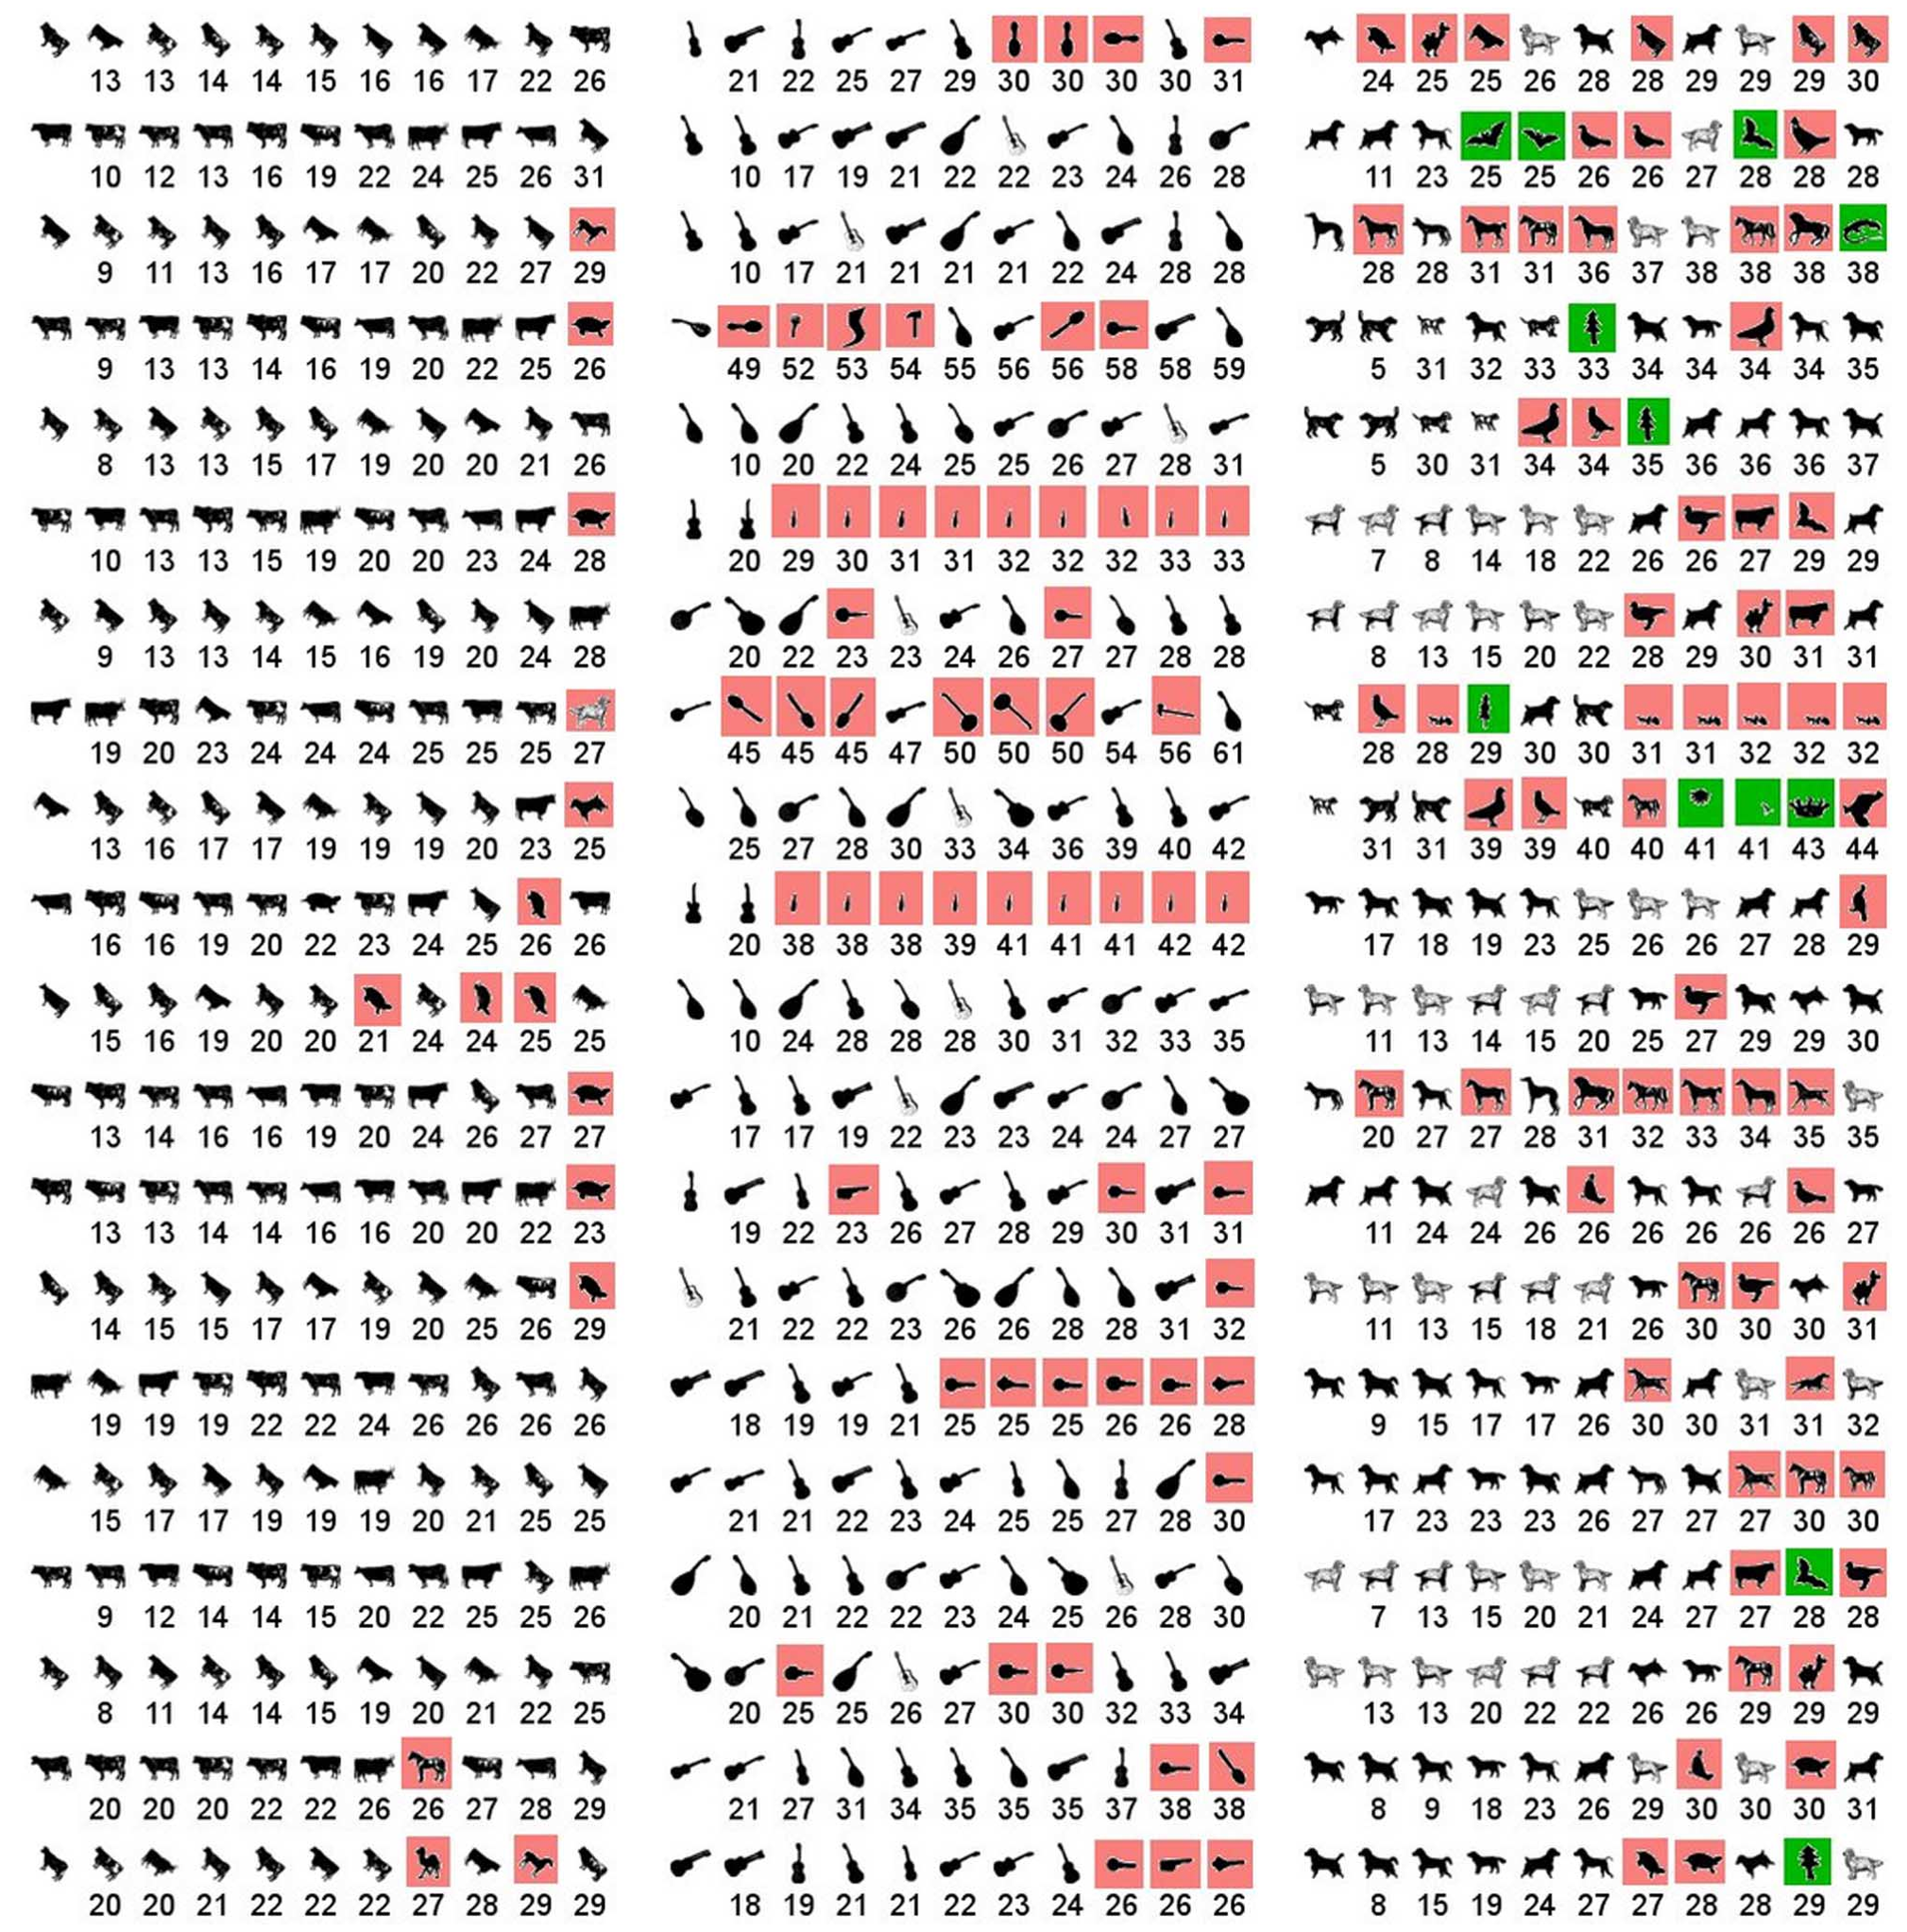 Figure 2: Top-ten matches for various categories. Note the visual "adaptive resemblances" between guitars and spoons.
Critical Insight: Efficiency vs. Robustness
The genius of this method is its retrieval speed. Because it reduces a shape to a fixed-length vector of 63 numbers, comparing two shapes is a simple weighted distance. No dynamic programming, no graph matching.
The Trade-off: The reliance on PCA makes the method sensitive to "severe occlusions." If a significant chunk of a shape is missing, the axes shift, and the quadrants no longer align. While it handles "standard" noise well, it isn't a "magic bullet" for shapes that are 50% obscured.
Conclusion
This paper serves as a bridge between low-level computer vision and cognitive psychology. By proving that 2-D regional analysis can match the performance of complex 1-D contour evolution, it paves the way for efficient indexing in massive digital libraries. For practitioners, the takeaway is clear: sometimes, looking at the "whole" is more effective (and faster) than meticulously tracking every "part."