
Smart Visualization: The Essential Bridge to Industry 4.0 in Investment Casting
Smart Data Visualisation as a Stepping Stone for Industry 4.0 - a Case Study in Investment Casting Industry
This paper presents an intelligent data visualization system tailored for the investment casting industry to facilitate Industry 4.0 retrofitting. By utilizing a custom-built simulator and a web-based MVC architecture, the system enables real-time monitoring and historical analysis of foundry processes despite initial data scarcity.
TL;DR
Industry 4.0 is often synonymous with Big Data, but what happens when a factory is just starting its digital journey and data is "scarce and faulty"? This paper details a bespoke smart visualization system for Zollern & Comandita, a legacy foundry. By combining a realistic process simulator with a web-based monitoring platform, the researchers provide a roadmap for "retrofitting" primitive industrial processes into intelligent, real-time ecosystems.
The "Data Gap" Problem
In investment casting (the lost wax method), the foundry department—comprising autoclaves and rotary furnaces—is a "black box." Information is rarely recorded, and human control predominates. Existing solutions like Grafana or Q-DAS are powerful but often require a level of digital maturity (and local hardware) that many SMEs haven't yet reached. The challenge is not just "seeing" data, but creating a system that understands the spatial logic of the factory floor.
Methodology: Simulating the Physical World
The core innovation lies in how the researchers handled the lack of real-world data. They didn't wait for sensors to be installed; they built a Digital Proxy.
1. The Rotary Furnace Logic
A rotary furnace moves parts through different temperature zones. Tracking which "tree" (the wax structure) is in which "bud" (the furnace section) is mathematically complex. The authors developed a modular arithmetic approach to track progress:
This allows the system to calculate the exact state of the furnace at any time , providing a "virtual sensor" where physical ones are still being installed.
2. Architecture: MVC & MTV
The system uses a robust tech stack:
- Backend (Django/MTV): Handles the business logic and database triggers that generate alerts.
- Frontend (Angular/MVC): A responsive web interface using Chart.js for real-time telemetry.
 Figure 1: The investment casting process stages from wax injection to finishing.
Experimental Validation & Results
The system was validated against three primary requirements (R1-R3):
- R1: Post-Production Post-Mortem: By analyzing historical pressure graphs from the autoclave, managers can now pinpoint exactly why a specific batch failed (e.g., a pressure drop during the 15-minute wax removal cycle).
- R2: Real-Time Shop Floor Insight: The interactive furnace map allows supervisors to click on any "bud" to see its contents and thermal history.
- R3: Expert Alert System: Triggers were set to identify deviations. For instance, if the steam generator fails to hit 12 bar, a notification is pushed instantly to the user's mobile device.
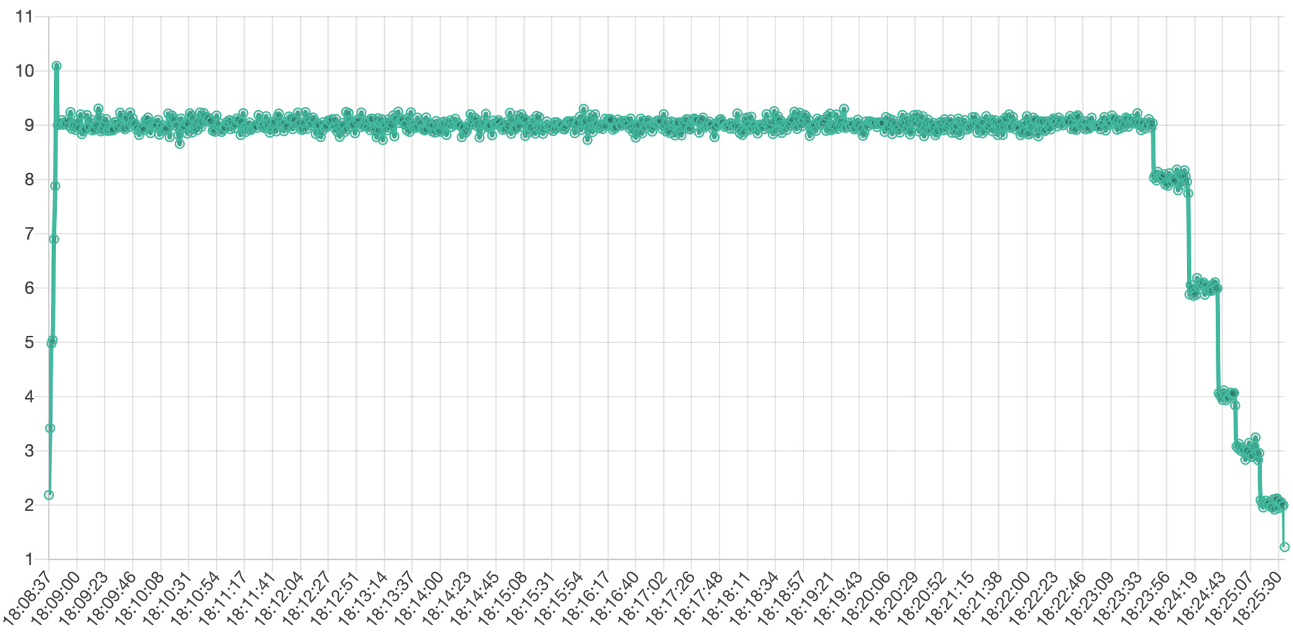 Figure 2: The interactive visualization of the rotary furnace loading state.
Critical Insight: Beyond Just "Charts"
This isn't just a dashboard; it's an Expert System. The true value lies in the Database Triggers. Instead of requiring a data scientist to analyze CSV files, the logic is embedded in the data layer. When a shelf exits the autoclave, a trigger automatically populates the next stage of the database, ensuring seamless "handshakes" between independent machines.
Limitations & Future Work
The primary limitation is the reliance on simulated data for the initial rollout. While the normal distributions mimic reality, they cannot capture "unknown unknowns"—sporadic mechanical jitters that a real sensor would. The next step involves replacing the simulator modules with raw PLC (Programmable Logic Controller) data as the factory's hardware retrofitting completes.
Conclusion
This study proves that Industry 4.0 doesn't have to be an "all or nothing" transition. Smart visualization, powered by process simulation and rigorous database logic, serves as the essential first step—turning raw, manual labor into a visible, manageable, and eventually, optimizable digital stream.